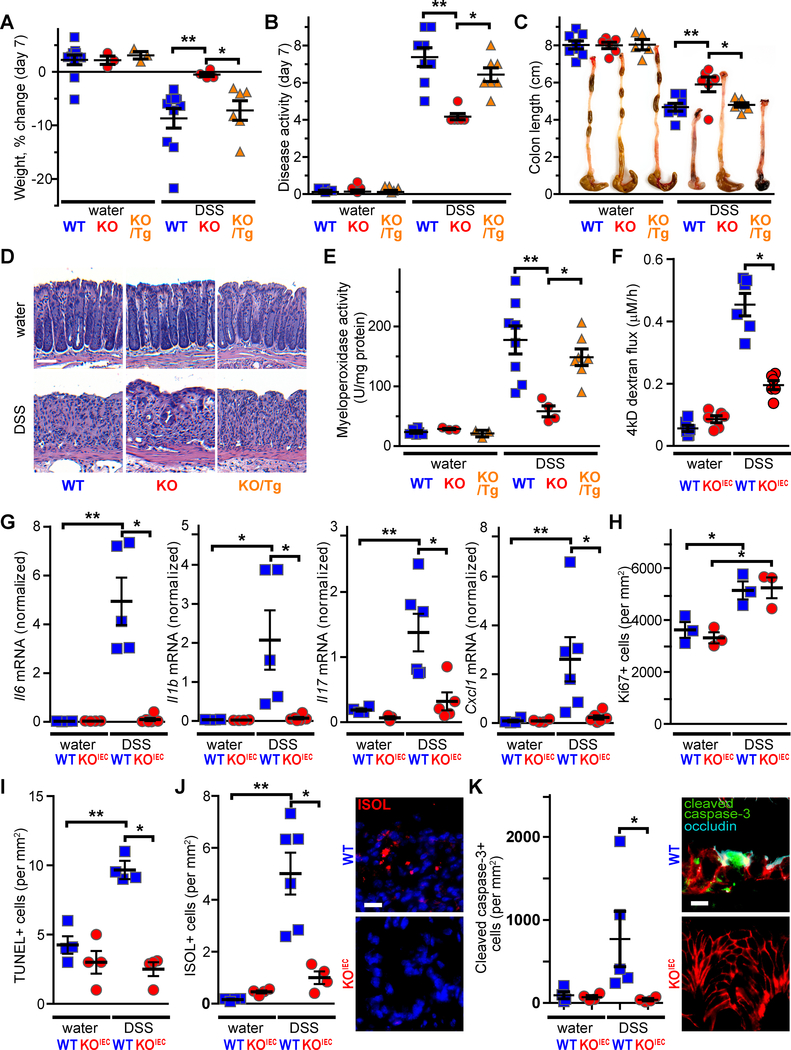
Figure 1. Intestinal epithelial occludin expression promotes DSS-induced intestinal disease.
A. DSS-induced weight loss was attenuated in occludin KO mice. Transgenic intestinal epithelial EGFP-occludin expression (Tg/KO) restored DSS sensitivity to that of WT mice. Analysis at day 7 is shown (n ≥ 3 for water groups and n ≥ 4 for DSS-treated groups). The complete time course is shown in Suppl. Fig. 2A.
B. Disease activity clinical scores were attenuated by occludin KO and restored by in Tg/KO mice (Day 7 data, n ≥ 6 per group). The complete time course is shown in Suppl. Fig. 2B.
C. Colonic shortening occurred in DSS-treated WT and Tg/KO mice but markedly reduced in occludin KO mice (n ≥ 6 per group).
D. Histopathology shows preservation surface epithelium and some crypts in DSS-treated occludin KO, relative to WT or KO mice with transgenic occludin expression. Bar = 50μm.
E. DSS-induced increases in myeloperoxidase activity were attenuated in occludin KO mice but restored to WT levels in Tg/KO mice (n ≥ 3 for water groups and n ≥ 4 for DSS-treated groups).
F. DSS-induced increases in intestinal permeability to 4 kD dextran were markedly attenuated in occludin KOiec mice (n ≥ 5 per group).
G. DSS enhanced Il6, Il1b, Il17, and Cxcll (KC, IL-8) expression in WT, but not occludin KOIEC, mice (n ≥ 5 per group).
H. DSS increased colonic epithelial proliferation, as assessed by Ki-67 staining, similarly in WT and occludin KOIEC mice (n ≥ 5 per group).
I. DSS increased numbers of TUNEL-positive cells in WT, but not occludin KOIEC, mice (n = 4 per group).
J. DSS increased numbers of ISOL-positive cells (red) in WT, but not occludin KOIEC, mice. Nuclei shown in blue. Bar = 20μm (n = 4–6 per group).
K. DSS increased numbers of cleaved caspase-3-positive cells (green) in WT, but not occludin KOiec, mice. Occludin (cyan) and E-cadherin (red) are shown for reference. Bar = 10μm (n ≥ 4 per group).
Ocln+/+ littermates were used as WT controls for Ocln−/− and Ocln−/− x vil-EGFP-occludin (Tg/KO) mice and Oclnf/f littermates were used as WT controls for Oclnf/f x vil-Cre (occludin KOIEC) mice in this and all other figures. Statistical analyses by one-way ANOVA with Bonferroni post-test. *, P<0.05; **, P<0.01.

