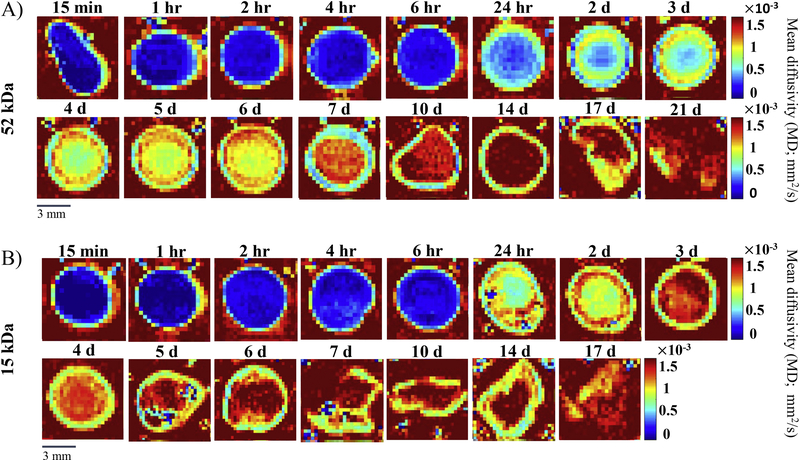
Figure 3: Apparent diffusion coefficient (ADC) maps of a representative implant at each time point.
A) ADC maps of the 52 kDa implant over 21 d. B) ADC maps of the 15 kDa implants over 17 d. Red represents high diffusivity, while blue represents low diffusivity. A different implant was imaged at each timepoint. The full set of ADC maps can be found in the supplemental material (Supplemental Figure 2).

