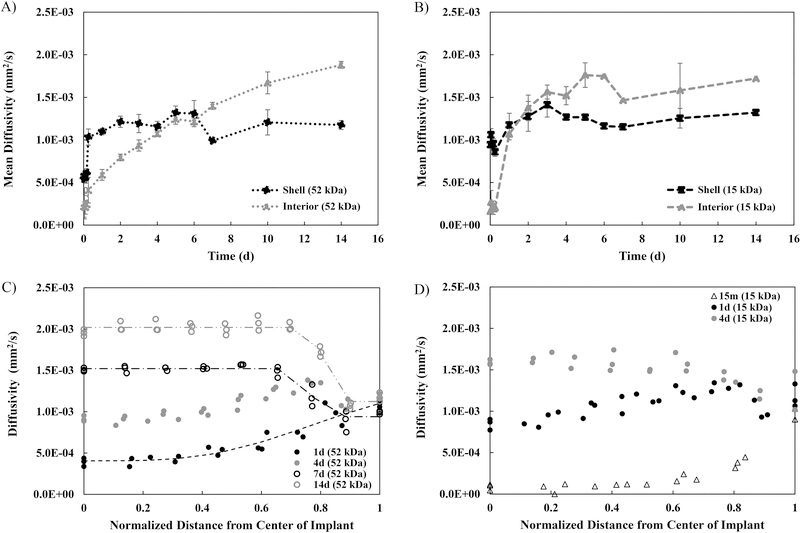
Figure 4: Spatial profiles of diffusivity from the ADC maps.
MD of the shell compared to the interior over 14 d for A) the 52 kDa implants and for B) the 15 kDa implants. Diffusivity as a function of distance from the center of the implant at selected timepoints for C) the 52 kDa implants and for D) the 15 kDa implants. For all, errors bars are mean ± SD. Sample size of n=3 except for the following implants due to implant degradation: 52 kDa 21d (n=1), 15 kDa 6d, 7d, 14d (n=2), and 15 kDa 17d (n=1).

