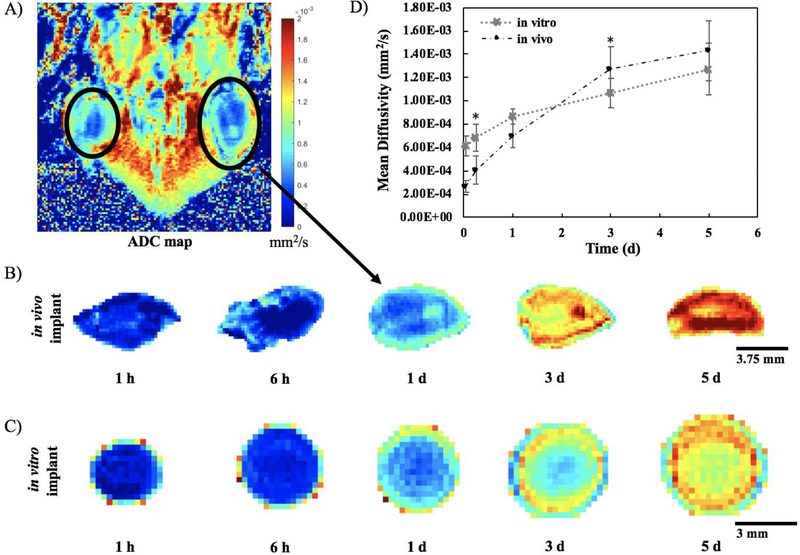
Figure 8: In vivo DWI analysis.
A) Representative ADC map from one slice through one mouse at 1 d. Top of the image is towards the head of the mouse and bottom of image is the tail. B) Representative in vivo implant isolated from the ADC maps at each timepoint. C) Representative in vitro implant isolated from the ADC maps at the same timepoints for comparison. D) Mean Diffusivity (MD) over 5 d comparing implants formed in vivo (n=6) versus those formed in vitro (n=3). (errors bars are mean ± SD). * indicates p < 0.05

