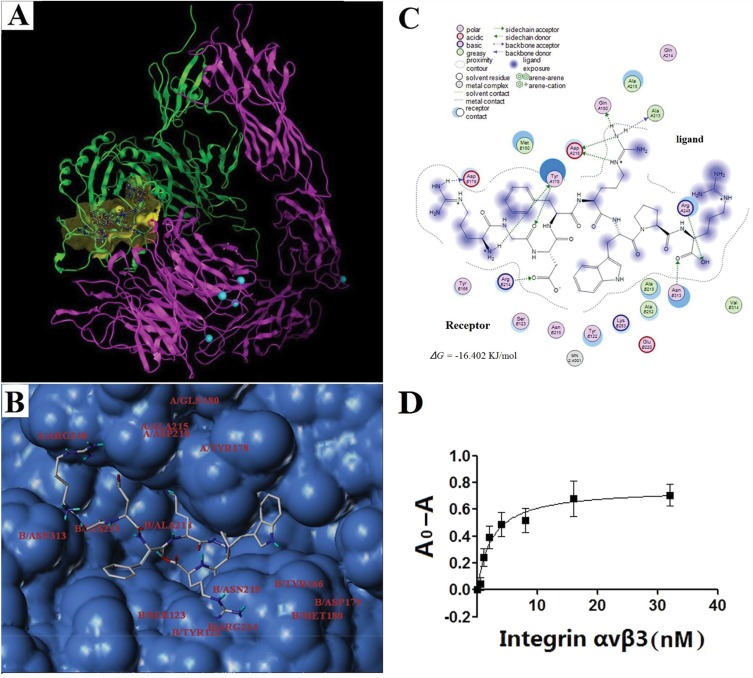
Figure 3.
The GCPF peptide targets integrin αvβ3.
Notes: (A) Ribbon drawing of the integrin αvβ3-GCPF structure simulated with molecular docking programs. In this figure, αv and β3 are shown in pink and green, respectively. The peptide is bound to the binding site (yellow). The carbon, nitrogen, and oxygen atoms of GCPF are shown in white, blue and red, respectively. The magnesium ions are shown as greenish blue balls. (B) Surface represents the GCPF-binding site. The GCPF peptide is shown as the stick model. The residues of the binding pocket in the structure of integrin αvβ3 are labeled. (C) The 2D image of interactions between GCPF and integrin αvβ3. (D) The dissociation constant of the GCPF peptide and integrin αvβ3 determined by ELISA experiments, where A0 and A are the absorbance measured in the absence of the receptor and at a given concentration of the receptor, respectively. n=3. Mean ± SD.

