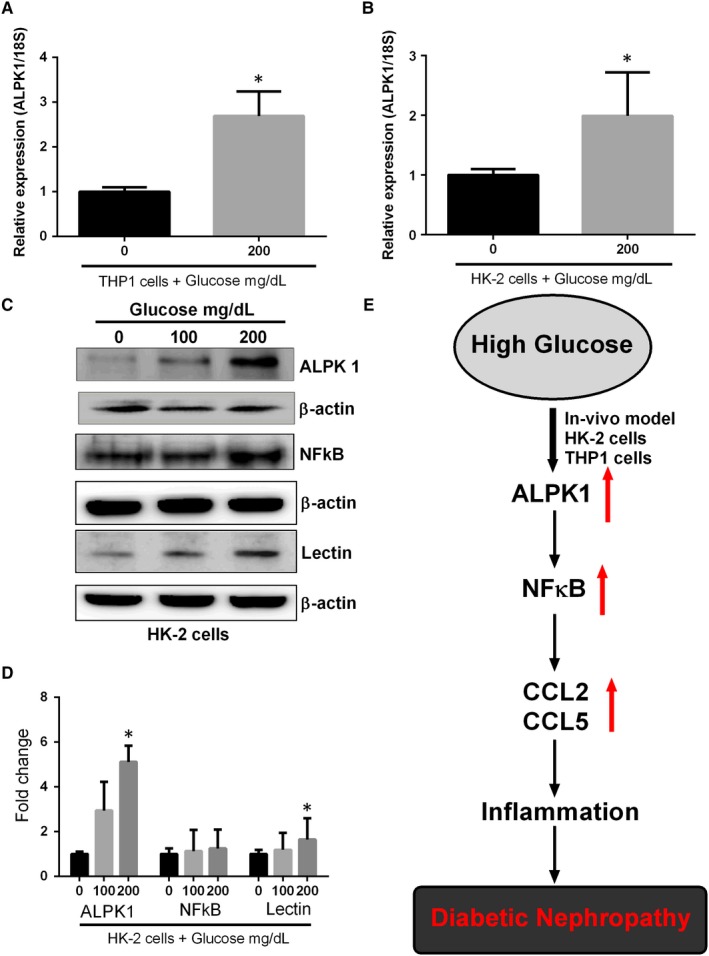
Figure 5.

Up‐regulation of ALPK1 in cultured kidney cells by glucose stimulation. THP1 and HK‐2 cells were treated with glucose for 48 h. Transcripts of ALPK1 were measured by RT‐qPCR. Glucose increased ALPK1 mRNA levels in (A). THP1 (B). HK‐2 cells. Graphs represent mean ± SD values, and each experiment was performed in triplicate (C). The protein expression of ALPK1, NFkB, lectin and β‐actin was determined by Western blotting in HK‐2 cells (D). The enhanced effect of glucose on ALPK1, NFkB and lectin protein expressions was plotted on the bar graph. ALPK1 protein signal was quantified by densitometry analysis and expressed as a fold change in respective control cells from three independent experiments (E). Schematic model showing that the ALPK1 regulates glucose induced nephropathy through CCL2 and CCL5 expressions. ∗P < .05 compared with the THP1 or HK‐2 cells without glucose stimulation
