
Figure 6.
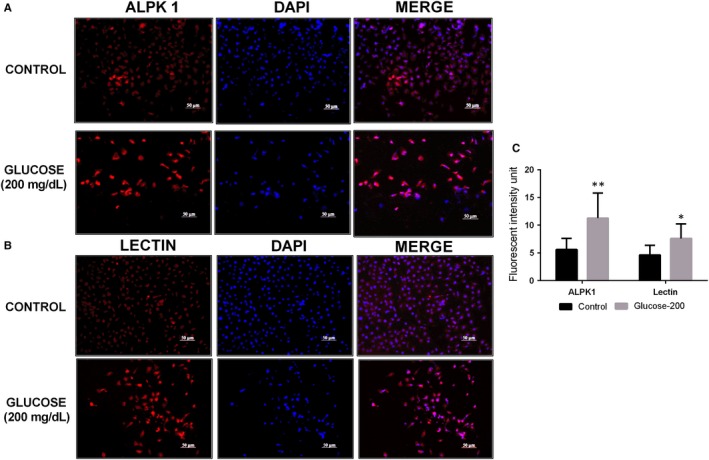
ALPK1 and lectin expression in HK‐2 cells. (A, B). Immunofluorescence staining showed a high level of ALPK1 and lectin expressions in HK‐2 cells treated with high glucose. Cell nuclei were stained with DAPI (Blue). (C). Quantification of cell fluorescent intensity. *P < .05 are compared with the control cells; **P < .01 are compared with the control cells