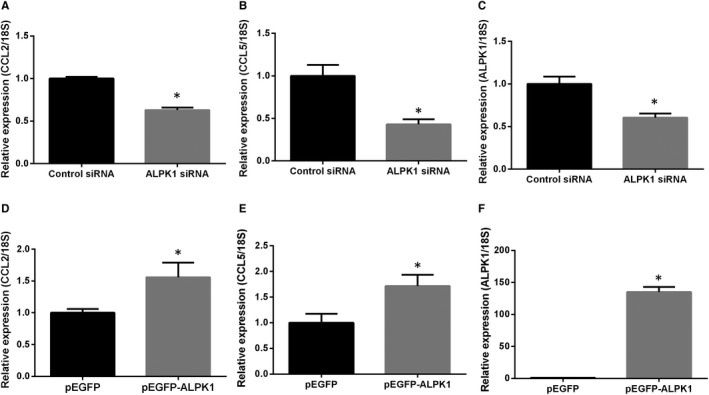
Figure 7.

Effect of ALPK1 on CCL2 and CCL5 expression in cultured kidney cells (A‐C). HK‐2 cells were transfected with ALPK1 or control siRNA for 48h. Transcripts of ALPK1, CCL2 and CCL5 were measured by RT‐qPCR (D‐F). HEK293 cells were transfected with pEGFP‐ALPK1 or control pEGFP vectors for 48 h. ALPK1, CCL2 and CCL5 mRNA levels were measured by RT‐qPCR. Results of RT‐qPCR were repeated for three times. ∗P < .05 compared with cells transfected with control siRNA/pEGFP vectors.
