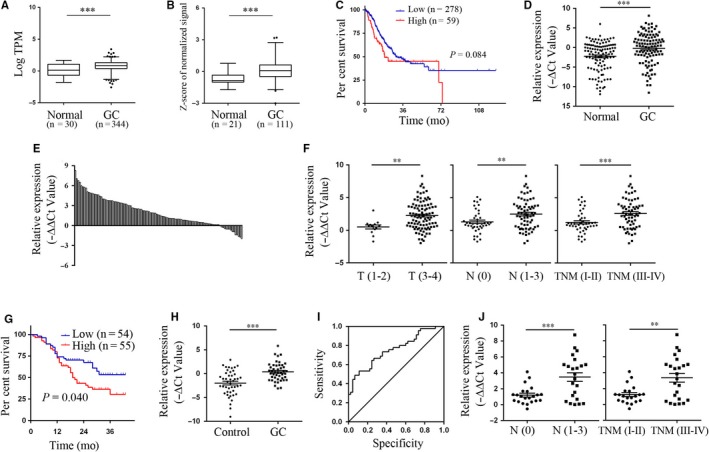
Figure 1.

Up‐regulation of LINC01225 in tumour tissues and plasma of patients with GC. A, B, Analysis of LINC01225 expression levels in TCGA dataset and GEO dataset GSE54129. C, Kaplan‐Meier analysis for overall survival in TCGA dataset according to the mean expression level of LINC01225. D, E, RT‐qPCR for the expression of LINC01225 in GC tissues and adjacent normal tissues. F, The correlation between tissue LINC01225 expression and invasion depth, lymphatic metastasis or TNM stage. G, Kaplan‐Meier analysis for overall survival according to the median expression level of LINC01225. H, The expression levels of plasma LINC01225 in patients with GC and healthy controls. I, The ROC curve for plasma LINC01225 on diagnosis of GC. J, The correlation between plasma LINC01225 expression and lymphatic metastasis or TNM stage. **P < .01, ***P < .001
