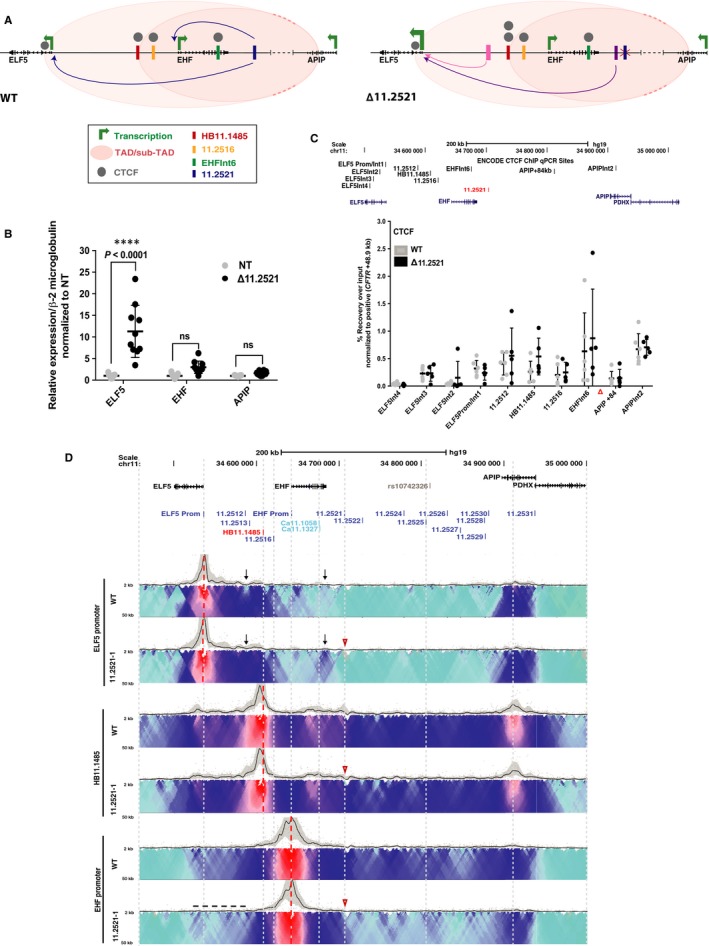
Figure 2.

Impact of deletion of cis‐element 11.2521 in A549 c9 cells. (A) 11.2521 interacts with both the ELF5 and EHF promoters (blue arrows) and enhances their expression. Upon deletion of 11.2521 (red X), ELF5 expression is enhanced. Additionally, interactions between the ELF5 promoter and DHS 11.2512/11.2513 (pink arrow) and an unknown element 3’ to the EHF locus (purple arrow) are evident. CTCF occupancy at 5’ sub‐TAD boundary HB11.1485 is slightly increased (two grey circles). (B) RT‐qPCR for ELF5, EHF and APIP expression in non‐targeted WT (NT) and deletion clones. Data are normalized to β2M and relative to clonal WT. Error bars are SD, n ≥ 3. ****P < .0001, ***P < .001, **P < .01, *P < .05, ns = not significant by a two‐way ANOVA test with multiple comparisons. (C) ChIP‐qPCR for CTCF enrichment at interacting sites across the 11p13 region in WT and deletion clones. ChIP results are shown as percent recovery over input and are normalized to a positive control (CFTR + 48.9 kb). Error bars are SD, n ≥ 3. (D) 4C‐seq data as in Figure 1 in WT and one 11.2521 deletion clone. Viewpoints are at ELF5 promoter, HB11.1485 and EHF promoter (red dotted lines). Open red arrowheads indicate the deletion site. Informative interactions or loss thereof are shown as black dotted line or black arrows
