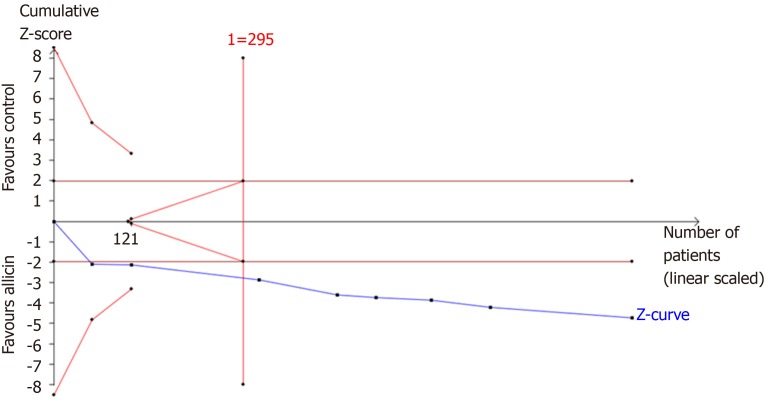
Figure 7.
Trial sequential analysis of the eradication rates. Trial sequential analysis of the eradication rates showed that an information size of 295 participants was required. Cumulative Z-curve crossed the trial sequential monitoring boundary, showing significant evidence of eradication rates. The cumulative values of the Z scores crossed conventional boundary values, trial sequential monitoring boundaries, and RIS line, suggesting that the trials were sufficient, and no alterations of the conclusions were likely.

