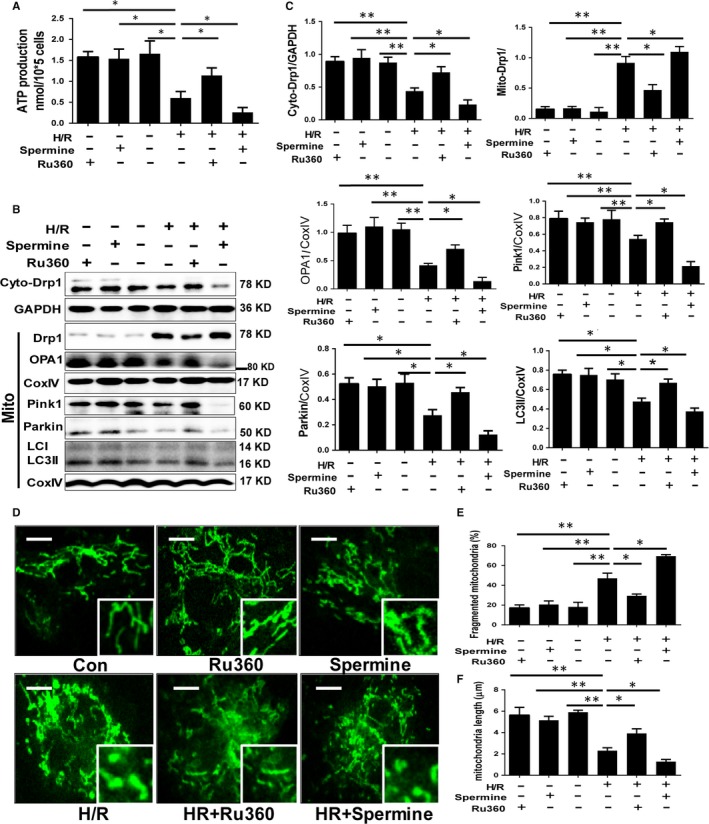
Figure 3.

The impact of MCU inhibition and activation on ATP production, mitochondrial fission, fusion and mitophagy. A, ATP production. B and C, Protein expression of mitochondrial fission, fusion and mitophagy by Western blot assay and quantitative analysis. D‐F, Mitochondrial morphology by MitoTracker Green staining and confocal microscopy of primary cardiomyocytes and quantitative analyses after 12h/3h H/R, with or without Ru360/spermine treatment, and quantitative analysis. The scale of the mitochondrial images is 10µm. Data are means ± SD from at least three different experiments. *P < .05, **P < .01
