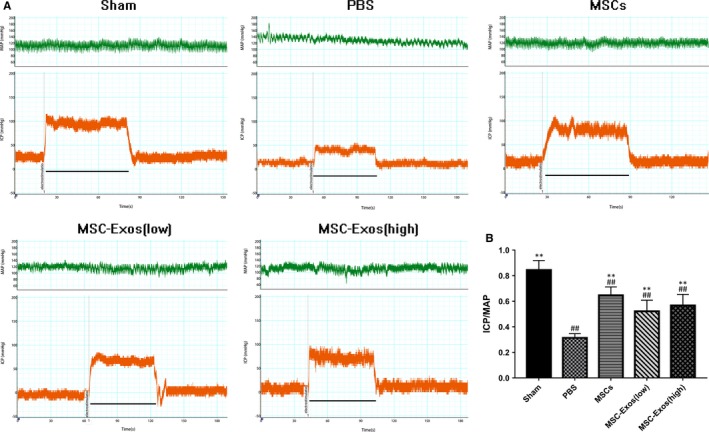
Figure 3.

Intracavernous pressure (ICP) and mean arterial pressure (MAP) during cavernous nerve electrostimulation at the fourth week after intracavernous (IC) injection. A, Representative ICP responses for the sham group, PBS group, MSCs group, MSC‐Exos (low) group and MSC‐Exos (high) group. The marker represents the start time of electrostimulation; the bar denotes the 60 s cavernous nerve electrical stimulation. B, The ratio of maximal ICP to MAP is recorded. Each bar depicts the mean ± standard deviation from n = 6 animals per group. **P < .01 vs the PBS group, ##P < .01 vs the Sham group
