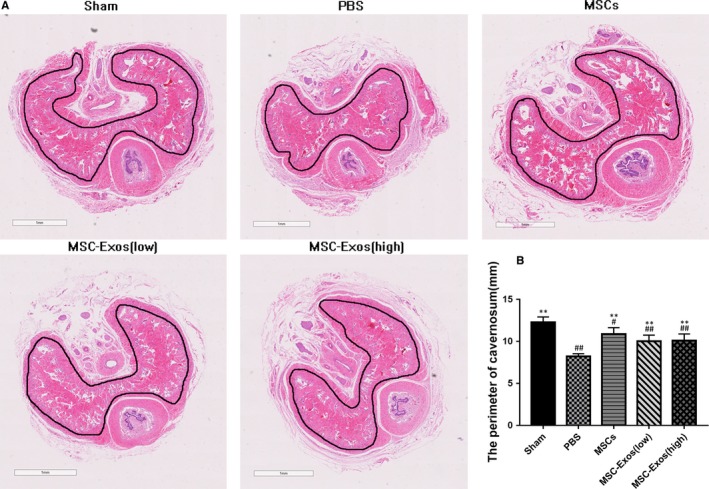
Figure 7.

The perimeter changes of corpus cavernosum. A, Representative photomicrographs of haematoxylin and eosin (HE) staining in cavernosum which perimeter indicated with dark line. B, The perimeter of corpus cavernosum is recorded from each group. Each bar depicts the means ± standard deviation from n = 6 animals per group. **P < .01 vs the PBS group, #P < .05 vs the Sham group, ##P < .01 vs the Sham group
