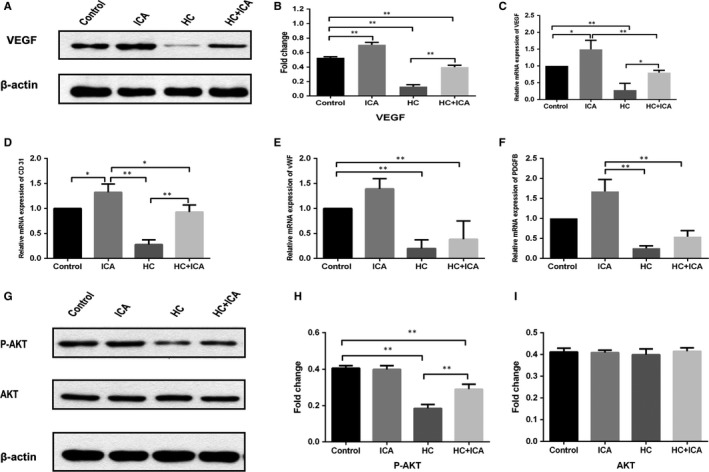
Figure 4.

Effect of ICA on angiogenic cytokine expression and the activation of Akt in BMECs. A, Western blot analysis of VEGF in BMECs following different treatments. B, The results of the Western blot were quantified, and the protein expression of VEGF was determined. C‐F, Quantitative RT‐PCR analysis of VEGF, CD31, vWF and PDGF‐B mRNA expression in BMECs following different treatments. G, Western blot analysis of Akt and p‐Akt in BMECs following different treatments. H‐I, The results of the Western blot were quantified, and the protein expression of p‐Akt and Akt was determined. Each condition was performed in triplicate, *indicated P < .05; **indicated P < .01
