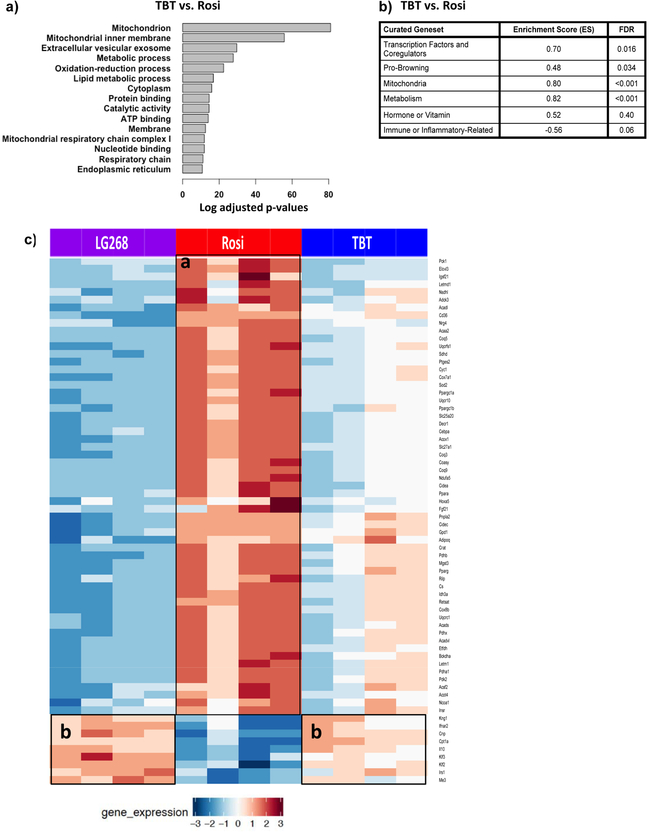
Figure 5. Pathway enrichment analyses related to brite/brown adipogenesis and mitochondrial biogenesis.
(A) Most significant differentially enriched pathways between the Rosi- and TBT-treated cells. (B) GSEA analysis of curated genesets related to brown adipocyte differentiation and mitochondrial biogenesis.(C) The heatmap displays the significant differentially expressed genes (fdr<0.05) related to mitochondrial biogenesis and adipocyte browning between Rosi, LG200268 and TBT.

