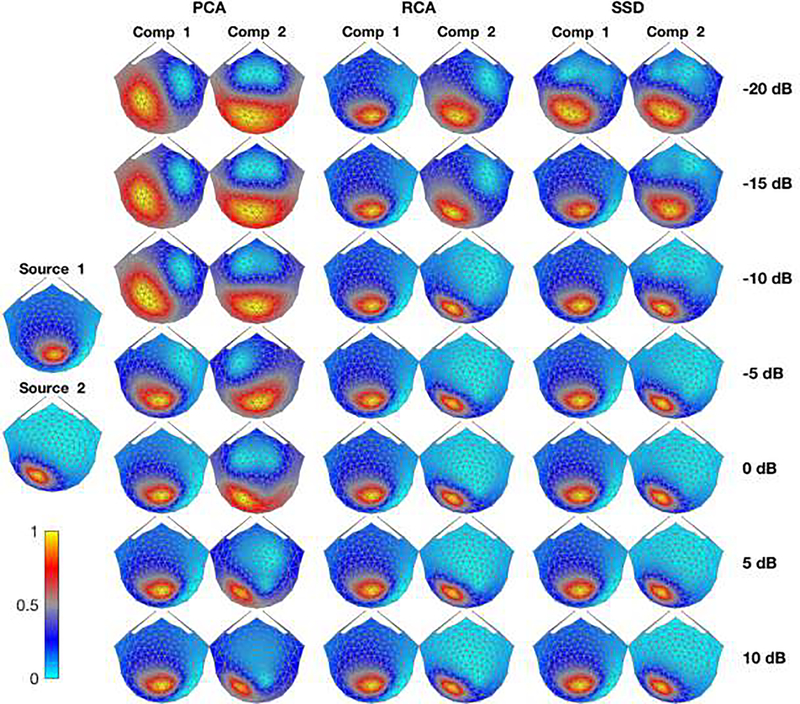
Figure 8. Spatial filter topography maps of three decomposition techniques.
The left most column presents the lead fields corresponding to source 1 (V2d-R) and source 2 (LO1-L) averaged over 10 subjects (Normalized to have values between 0 and 1). The normalized topographic maps of each filter for their first and second component are presented (averaged over 10 subjects and trials) over different SNR values (each SNR value is presented in one row) are shown in the second to sixth columns.

