Fig. 3.
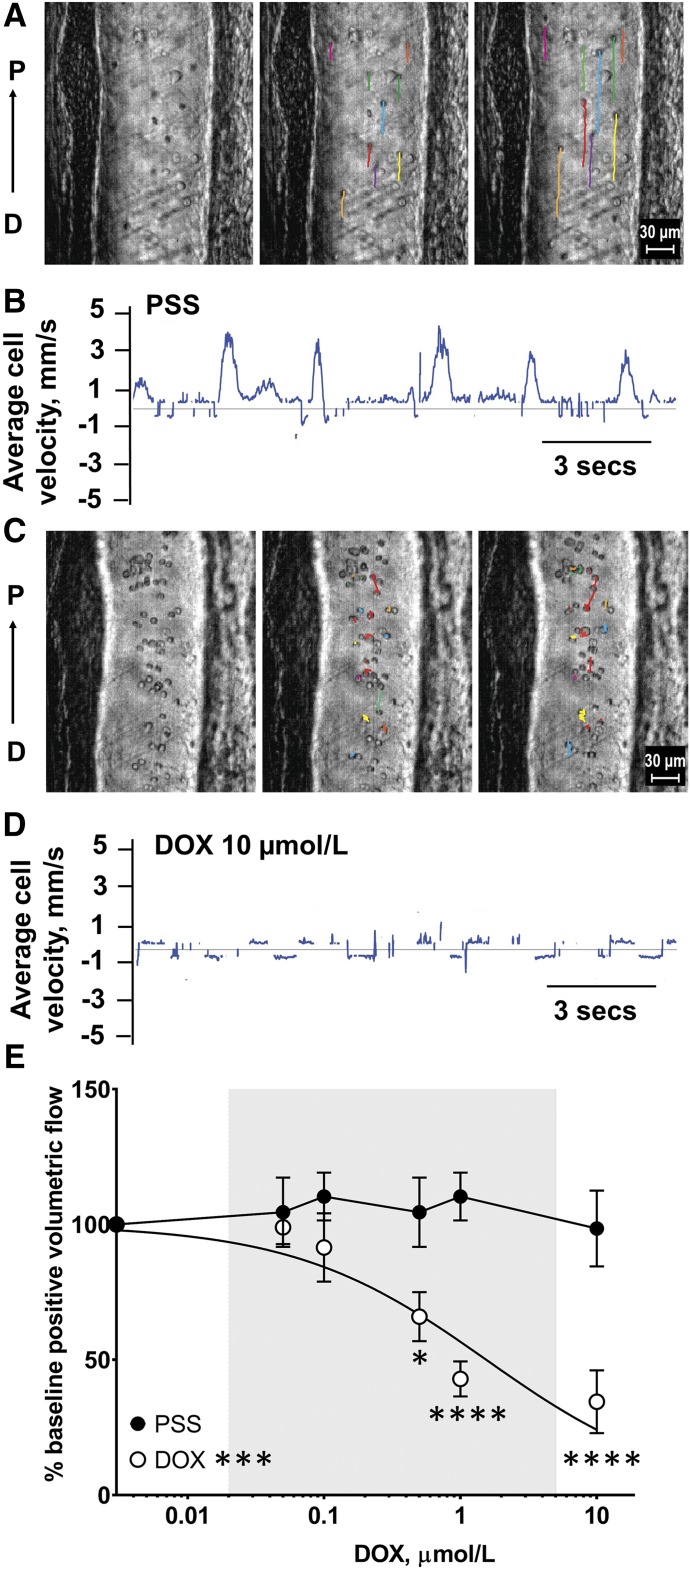
Superfusion of DOX decreases volumetric lymph flow in rat mesenteric lymph vessels. (A) Prior to DOX superfusion, frame-by-frame cell tracking (300 frames/sec video capture) measures the distance traveled by a cell in lymph fluid as a function of time, which provides an estimate of cell velocity. Representative still images are shown in 10 frame intervals over the course of 20 frames (sampled every 67 milliseconds). Colored lines represent individual cell paths from initial frame. (B) Upward and downward deflections reflect average positive and negative cell velocities, respectively, in lymph vessels prior to superfusion of DOX. (C) Superfusion of DOX (10 μmol/l) decreased cell path lengths and (D) reduced average lymph cell velocity (seen as attenuated upward deflections) indicating the induction of “lymphostasis.” (E) Increasing concentrations of DOX (0.5–10 μmol/l) decreased positive volumetric lymph flow (IC50 = 1.54 μmol/l). Gray shading denotes clinically achievable plasma concentrations of DOX at ≤4 hours after an intravenous push infusion. Data reported as mean ± S.E.M. and analyzed using two-way ANOVA with Holm-Sidak post-test (n = 5 and 6; *P < 0.05; ***P < 0.001; ****P < 0.0001).

