
Figure 2.
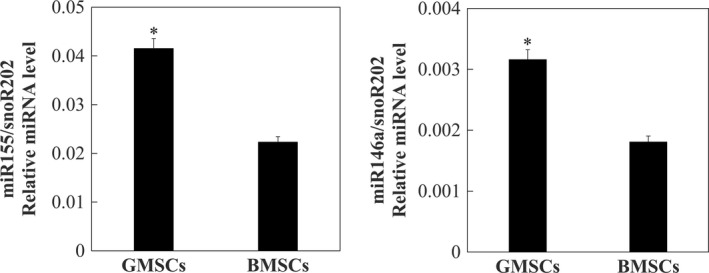
Expression of miR‐146a and miR‐155 in GMSCs and BMSCs. Cells from the third passage were used in this experiment. Data are presented as means and standard errors (n = 3). Detection and quantitation of miR‐155 (left panel) and miR‐146a (right panel) were performed by means of RT‐qPCR using the snoR202 gene as a reference for data normalization. *Significant differences between GMSCs and BMSCs, P < .05