
Figure 4.
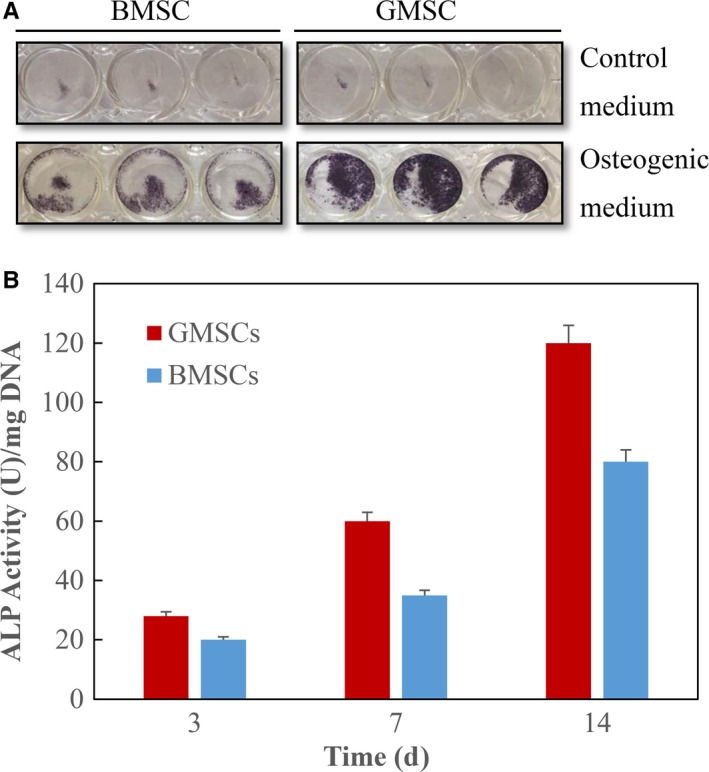
ALP‐positive cells and ALP activity. A, ALP‐positive staining (blue) appeared at day 7 after osteogenic induction. ALP‐positive cells were more prominent in GMSCs compared with BMSCs. B, ALP activity measured by the colorimetric pNPP assay. Each value is mean ± SD; n = 3. The ALP activity was increased significantly over the course of the experiment. At both 7 and 14 d, GMSCs had higher ALP activity than BMSCs (P < .05)