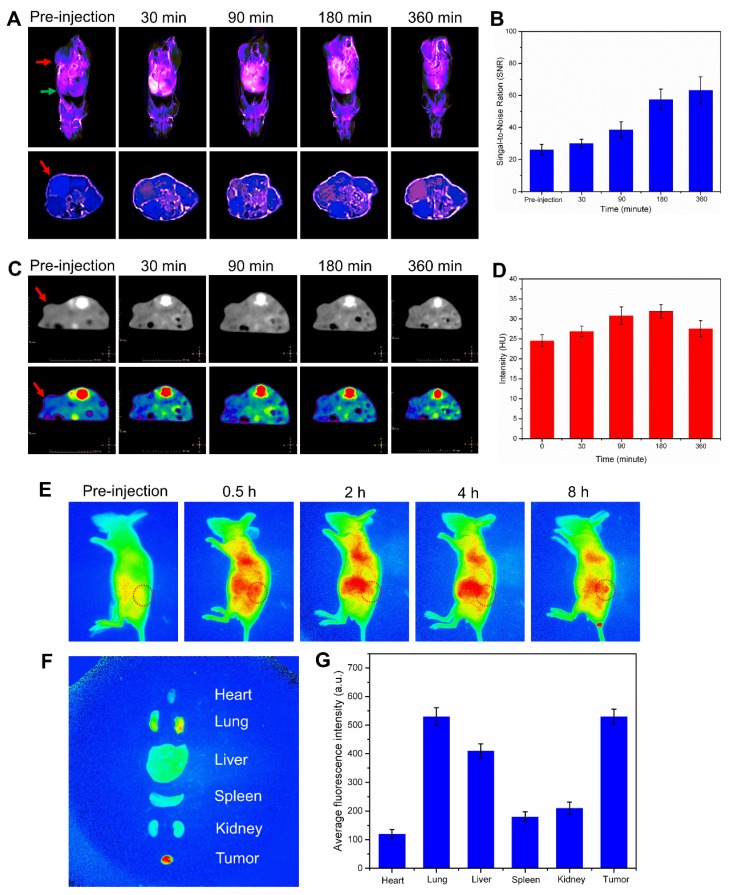
Figure 4.
Biodistribution and excretion of Mn@CaCO3/ICG@siRNA in LLC tumor-bearing mice. (A) In vivo T1-weighted MR imaging of LLC tumor-bearing mice before and after intravenous administration of Mn@CaCO3/ICG@siRNA. Red arrows point the tumor region, and green arrow points the liver region. Upper images show the longitudinal section of the mice, while lower images show the transverse section. (B). Quantitative analysis of the T1-MR signals from the tumor region. (C) Transverse CT images of LLC tumor-bearing mice. The arrows in the CT images indicate the tumor region. (D) Quantitative region of interest analysis (CT intensity) of tumor pre-injection and post-injection of Mn@CaCO3/ICG@siRNA. (E) Real-time fluorescence imaging of LLC tumor-bearing mice before and after i.v. injection of Mn@CaCO3/ICG@siRNA. Red circles indicate the region of the tumor. (F) Ex vivo fluorescence images of mice organs or tissue. (G) Quantitative analysis of the fluorescence signals.

