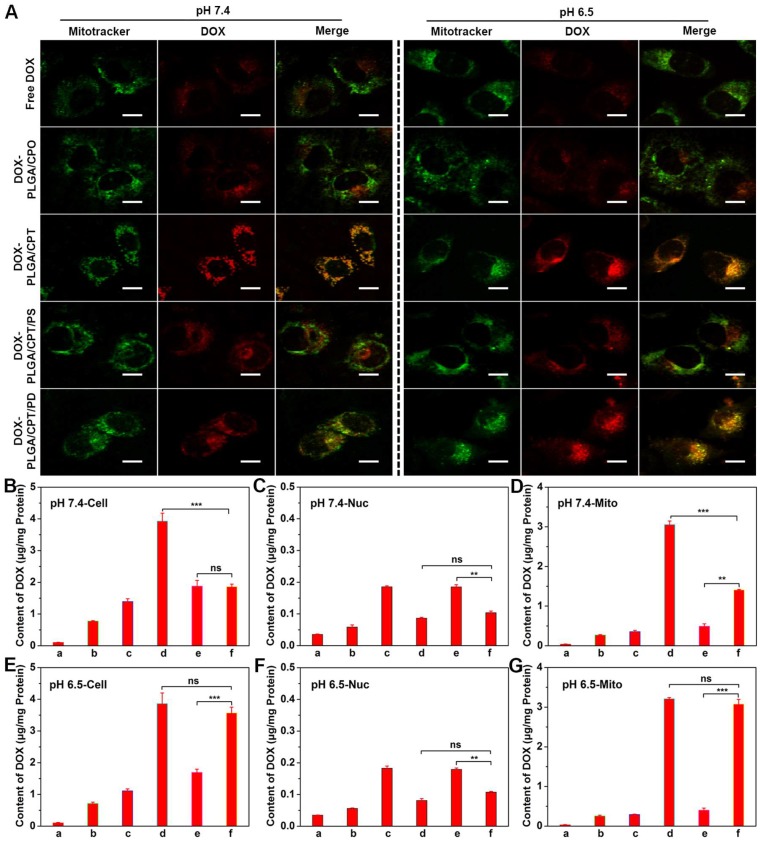
Figure 3.
(A) CLSM images of MCF-7/ADR cells for co-localization of DOX and mitochondria, scale bar = 20 μm. (B-G) DOX contents in the whole cells, nuclei (Nuc), and mitochondria (Mito) at pH 7.4 or pH 6.5 after various treatments. a, PBS; b, free DOX; c, DOX-PLGA/CPO; d, DOX-PLGA/CPT; e, DOX-PLGA/CPT/PS; f, DOX-PLGA/CPT/PD. Data are presented as mean ± S.D (n=3). Non-significant (ns), P > 0.05, **P < 0.01, ***P < 0.001.

