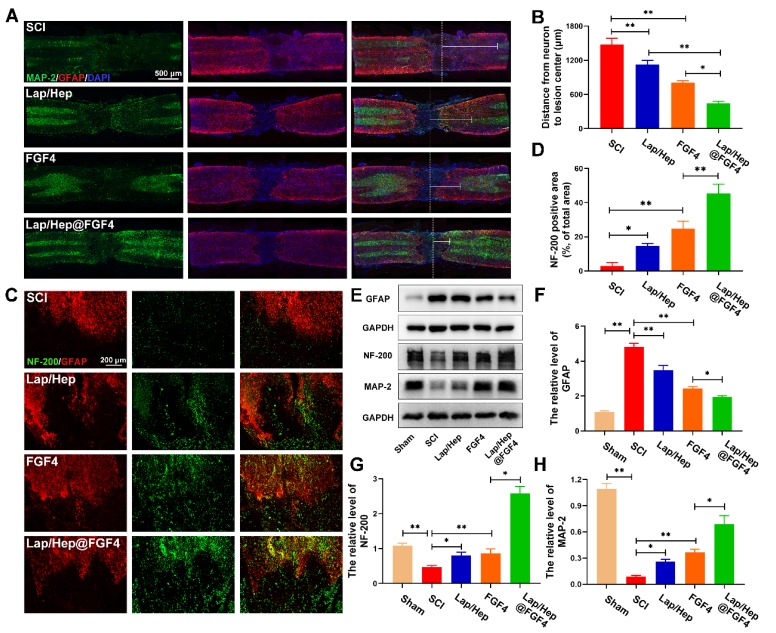
Figure 3.
Lap/Hep@FGF4 enhances axonal regeneration after SCI. (A) Co‐immunofluorescence images show GFAP (red) and MAP-2 (green) at 28 days after SCI in each group, the white triangle and dotted line indicate border of lesion site. The white dash line indicated the lesion center. (B) Quantification of distance from neurons to lesion center. (C) Representative images containing astrocytic and neurofilament (NF-200) immunofluorescence on spinal cord sections at 28 days after SCI. (D) Quantitative analysis of NF-200 positive axon area in the lesion. (E-H) Western Blot (WB) protein expressions and quantification data of GFAP, NF-200 and MAP-2 in each group. All experiments were performed in triplicate and values were expressed as the Mean ± SD, n= 4 per group.

