Figure 3.
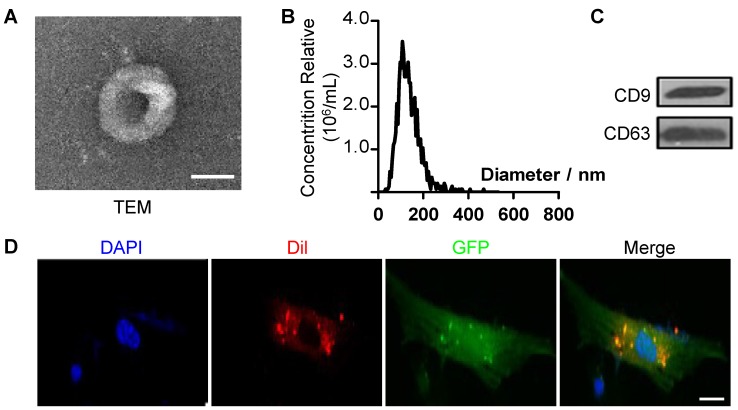
Characteristics of extracellular vesicles derived from ES cells. (A) TEM image of ES-EVs. Scale bar, 100 nm. (B) Size distribution of ES-EVs was measured by dynamic light scattering. (C) The expression of CD9 and CD63 in ES-EVs was analyzed using western blotting. (D) Internalization of ES-EVs was analyzed by immunofluorescence detection. Dil-labeled exosomes (red) was detected in the MSCs which expressing green fluorescent protein (GFP, green). Scale bar, 10 μm.

