Figure 1.
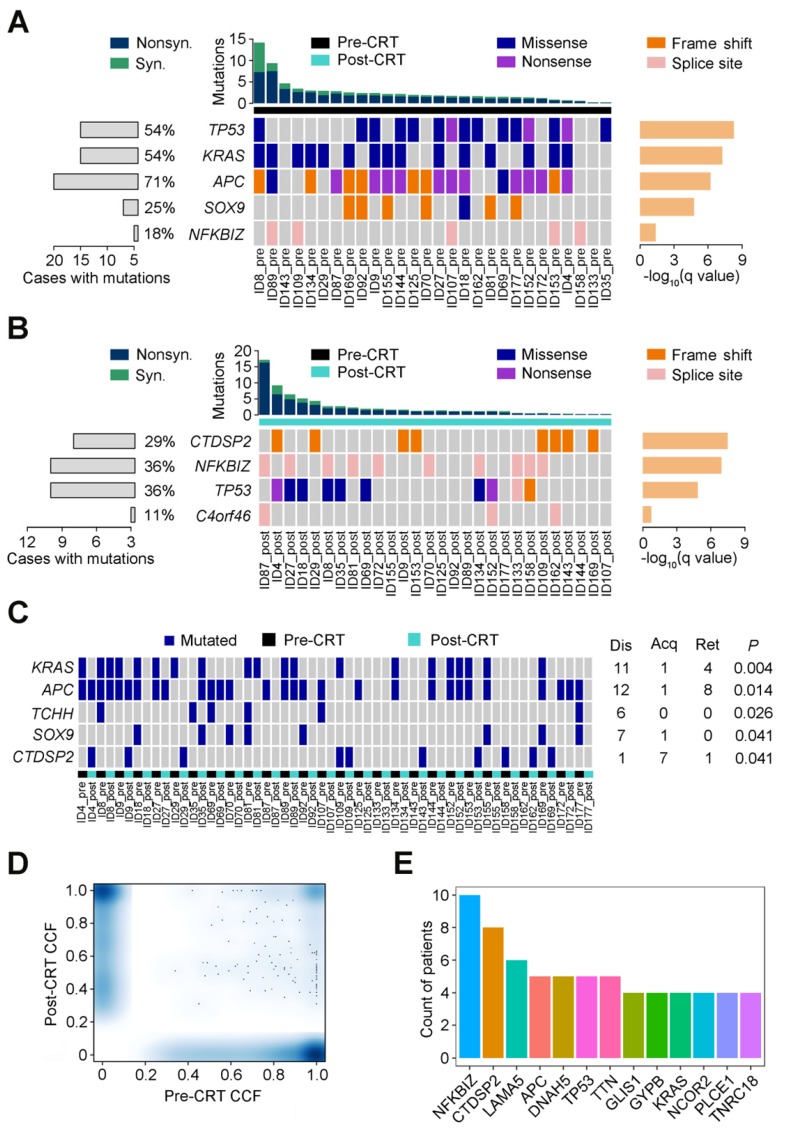
Recurrent mutations in rectal cancer before and after CRT. Significantly mutated genes are arranged according to q value (using MutSigCV algorithm). Each column represents a tumor and each row represents a gene. Samples are arranged in the descending order of mutation rate. The bottom center panel demonstrates significant gene landscape. The top panel displays the overall mutation rate in each tumor. The bottom left graph shows percentages of cases with mutations. The bottom right graph denotes -log10 (q) for significance level of mutated genes. Samples are divided into pre-CRT set (A) and post-CRT set (B). Mutation types are shown by colors as indicated. (C) Gene mutation counts in post-CRT tumors differ significantly from pre-CRT tumors. Every two columns represent a matched pre- and post-CRT tumor pairs and each row represents a gene. The left heatmap demonstrates gene mutation status (whether or not) in coding regions in 28 pairs of samples. The right graph shows the number of patients with the mutations disappeared (dis), acquired (acq) and retained (ret) after CRT treatment. The P value denotes the significance level of the difference in mutation counts between pre-CRT and post-CRT tumors. (D) Smoothed color density scatter plot, obtained through a (2D) kernel density estimate, of pre-CRT and post-CRT cancer cell fractions (CCFs) of each mutation in all samples. Dots off the axes indicate mutations in both of pre-CRT and post-CRT tumors while dots on the axes indicate mutations in either pre-CRT or post-CRT tumors. (E) Coding mutations in 13 genes were selected under CRT treatment (CCF became higher after CRT) in more than 3 patients.

