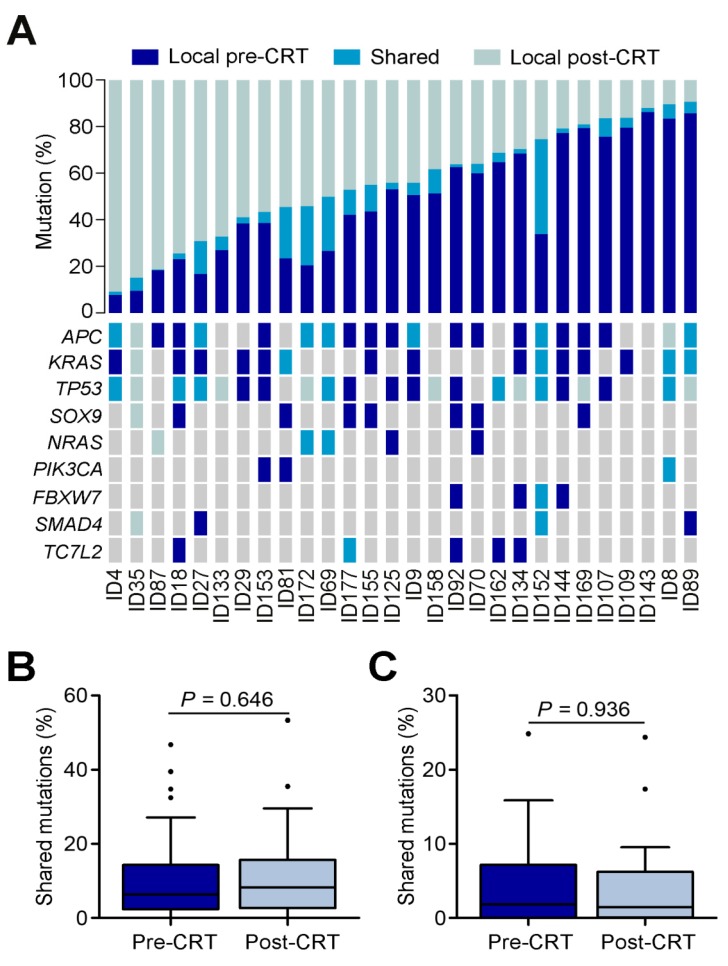
Figure 2.
Mutational heterogeneity in CRT-resistant rectal cancer. (A) Percentages of shared and unique mutations (top) and mutational status (bottom) of selected driver genes reported in TCGA data set of colorectal cancer in matched pre- and post-CRT tumors. Each column represents a matched pre-CRT and post-CRT tumor pairs. (B) Boxplot of shared mutations inferred as clonal between pre- and post-CRT tumors. (C) Boxplot of shared mutations inferred as subclonal between pre-CRT and post-CRT tumors.

