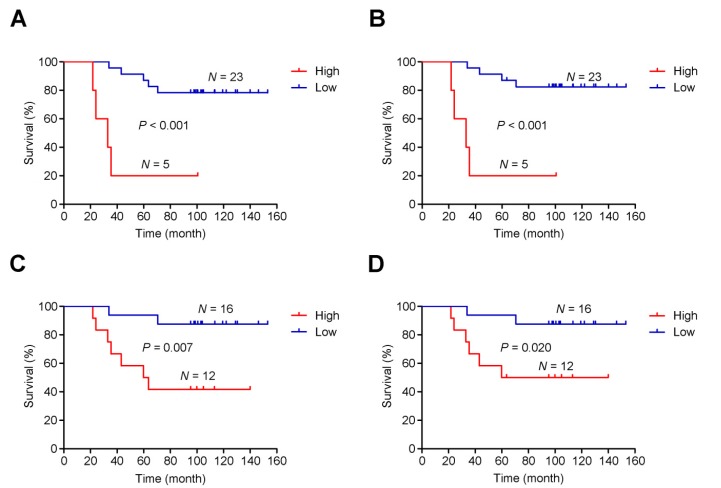
Figure 6.
Association between intratumoral heterogeneity and survival. The cumulative risk of intratumoral heterogeneity is shown by the Kaplan-Meier survival curves between patients with low intratumoral heterogeneity (blue) and patients with high intratumoral heterogeneity (red): (A) Overall survival in pre-CRT patients, (B) Cancer-specific survival in pre-CRT patients, (C) Overall survival in post-CRT patients, and (D) Cancer-specific survival in post-CRT patients.

