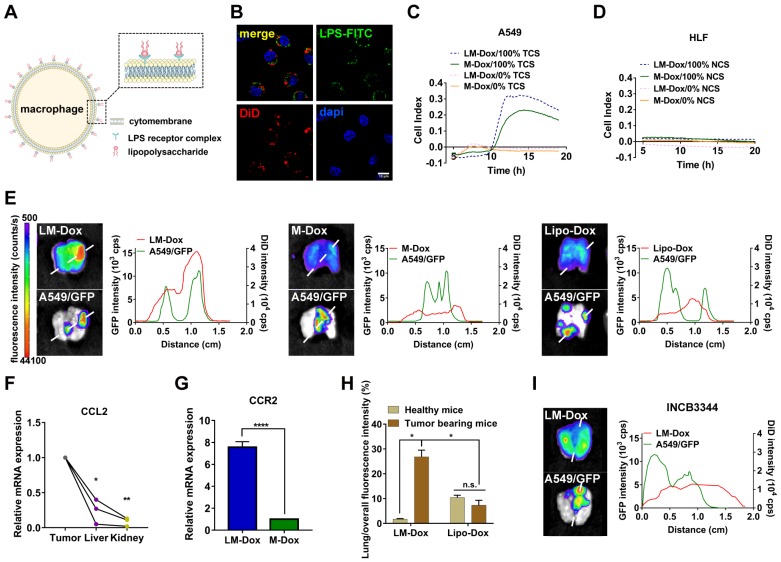
Figure 1.
Evaluation of tumor tropism of LM-Dox in vitro and in vivo. (A) Schematic diagram showing the binding of LPS to macrophages. (B) CLSM images showed LPS-FITC anchored on the surface of macrophages at 48 h. The nuclei were stained with DAPI and plasma membranes were labeled with DiD. LPS-FITC produced a green fluorescence. The merged images were the overlay of three individual images. Scale bar, 10 μm. (C-D) Representative real-time traces of LM-Dox and M-Dox towards human lung tumor A549 cell culture supernatants (NCS) and human lung normal HLF cell culture supernatants (TCS). (E) Representative fluorescence images of excised lungs at 24 h post-injection of DiD-labeled LM-Dox, DiD-labeled M-Dox and DiD-labeled Lipo-Dox (left). The fluorescence intensity of DiD signal and A549/GFP across the lung tissue with cancer (right). (F) Validation of CCL2 gene expression in tumor nodules, liver and kidney by real-time qPCR analysis. (G) Expression of RNA for CCR2 in LM-Dox and M-Dox. Data are derived from quantitative PCR. (H) Lung accumulation of DiD-labeled LM-Dox and DiD-labeled Lipo-Dox in healthy mice and orthotopic lung tumor-bearing mice were calculated by the ratios of DiD fluorescence intensity of lung tissues to total DiD fluorescence intensity. (I) The CCR2 antagonist INCB3344 was administered to mice by oral gavage. 12 hours later, mice were injected with DiD-labeled LM-Dox. Representative fluorescence images of excised lungs at 24 h post-injection of LM-Dox (left). The fluorescence intensity of DiD signal and A549/GFP across the lung tissue with cancer (right). The data are shown as mean ± s.d., * is p < 0.05, ** p < 0.01 by one-way ANOVA test or two-way ANOVA test.

