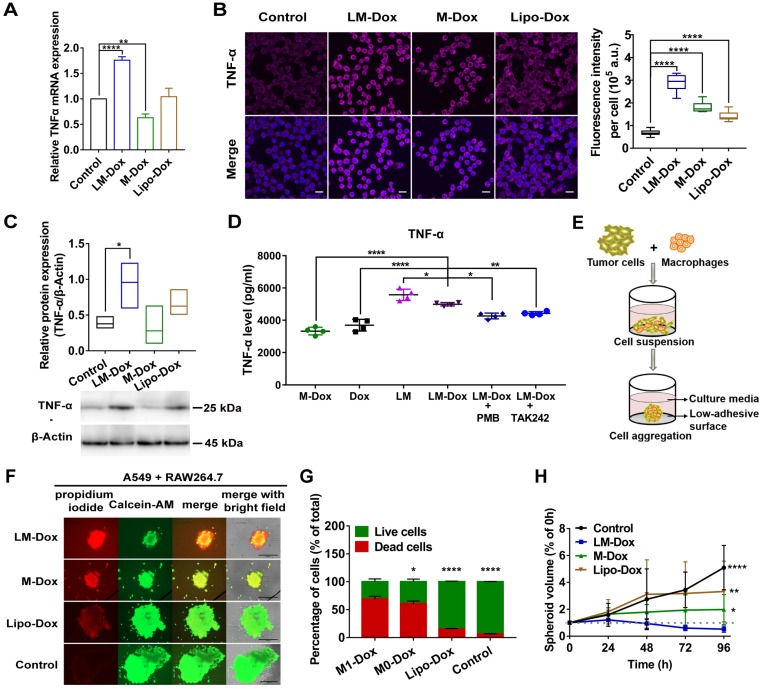
Figure 4.
LM-Dox induced TNF-α secretion from TAMs. (A) Total RNA isolated from TAMs after exposure to LM-Dox, M-Dox and Lipo-Dox was examined by real-time qPCR and the mRNA levels of TNF-α were normalized to the control GAPDH mRNA levels. (B) Confocal microscopic images of immunofluorescent labeling for TNF-α (purple) in TAMs. Cell nuclei were stained with DAPI (blue) in all images. Scale bars, 20 µm. Quantitative analysis of fluorescent intensity was performed in at least ten independent visual fields of immunofluorescence images. (C) Quantification of protein levels of TNF-α in TAMs. Whole-cell extract was prepared and quantified. An equivalent amount of total protein was analyzed with antibodies against TNF-α and β-Actin as the loading control. (D) The TNF-α levels in the culture medium were analyzed by ELISA. PMB was used to block the effect of LPS-induced activity. TAMs were pretreated with TAK242 before incubated (n = 3). (E) Schematic depicting tumor-immune spheroid formation where cell spheroids have been generated by culturing A549 tumor cells in combination with RAW264.7 macrophages. (F) Calcein-AM (green)/PI (red) assay was used to visualize the live cells (green) and dead cells (red) in spheroids. Scale bars, 400 μm. The spheroids were incubated with LM-Dox, M-Dox and Lipo-Dox, respectively (equivalent to 4.0 µM Dox) for 72 h. (G) The relative fluorescence intensities of the red-fluorescent (PI, λex 535 nm, λem 617 nm) dead cells versus the green-fluorescent (Calcein-AM, λex 490 nm, λem 515 nm) live cells were determined, indicating a significant increase in cell death followed by the LM-Dox treatment. (H) The volume of spheroids was calculated and normalized to the volume before treatments. Statistical analysis of images was based on ImageJ quantification of randomly selected fields of spheroids (n > 5) for each treatment. The data are shown as mean ± s.d., * is p < 0.05, ** is p < 0.01, *** is p < 0.001, **** is p < 0.0001, n.s. is p > 0.05 by one-way ANOVA test.

