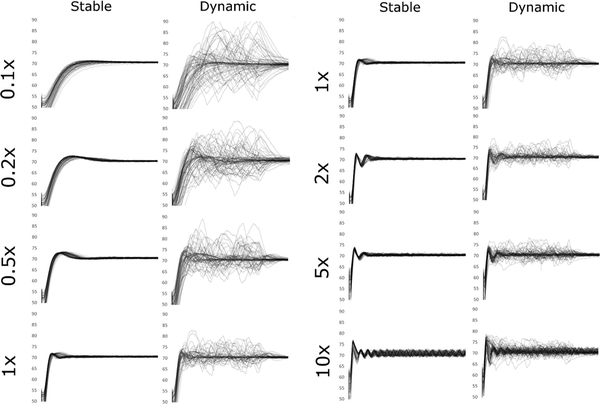
Fig. 1.
Mean arterial pressure plots from each study condition. Each individual 60-min simulation run is represented by a single line in the graph for each condition. In the Stable conditions the simulated patient has a constant degree of vasodilation applied. In the Dynamic conditions, the background vasodilation ‘wanders’ at random to new values, creating a more challenging management condition for the controller. Moreover, the rate of change of the background vasodilation was allowed to occur very quickly to challenge the controller. 0.1 ×, 0.2 ×, and so on refer to the simulated patient norepinephrine response relative to the standard “1 ×” response patient

