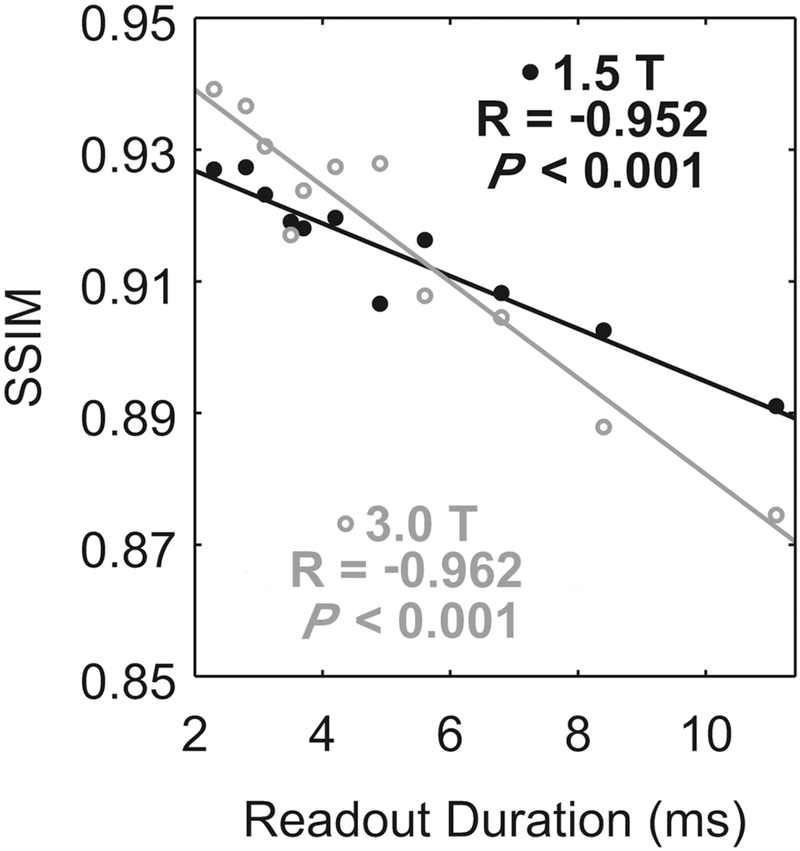
Figure 6. Image quality was diminished with increasing readout duration.
The mean of the subjects is represented either by closed, black circles (1.5 T) or by open, gray circles (3.0 T). The solid lines are the linear fits to the corresponding means. At both field strengths, global image quality was significantly correlated with the readout duration.

