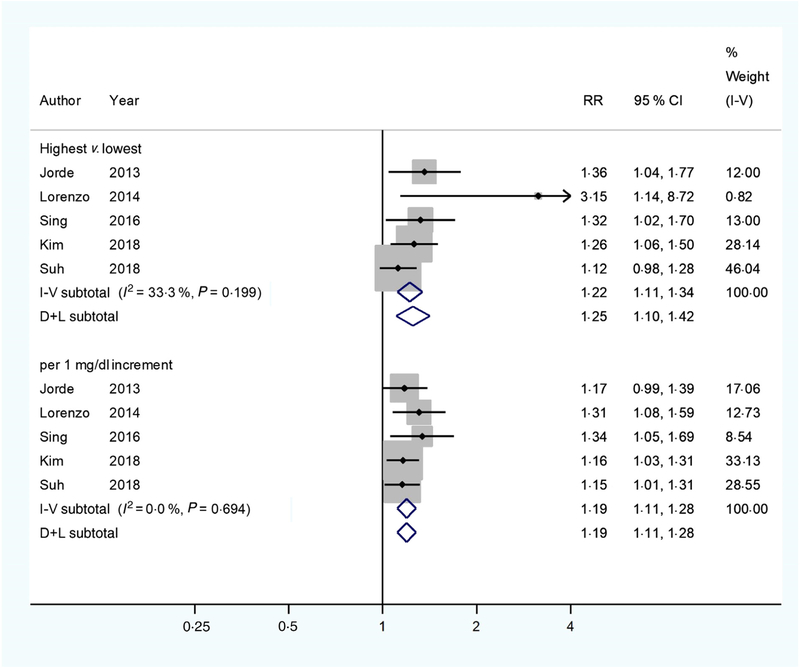
Fig. 3.
Multivariable-adjusted relative risks (RR) (◆) and 95 % confidence intervals (—) of type 2 diabetes mellitus (T2DM) in relation to serum total calcium levels. The summary assessments (◇) were obtained by adopting a random-effects model. Values are adjusted RR comparing the highest with the lowest category levels or per 1 mg/dl increase in serum total calcium. The size of the shaded square is proportional to the weight of each study. We requested de novo data from the authors of Kim et al.(22) and Suh et al.(27), respectively.

