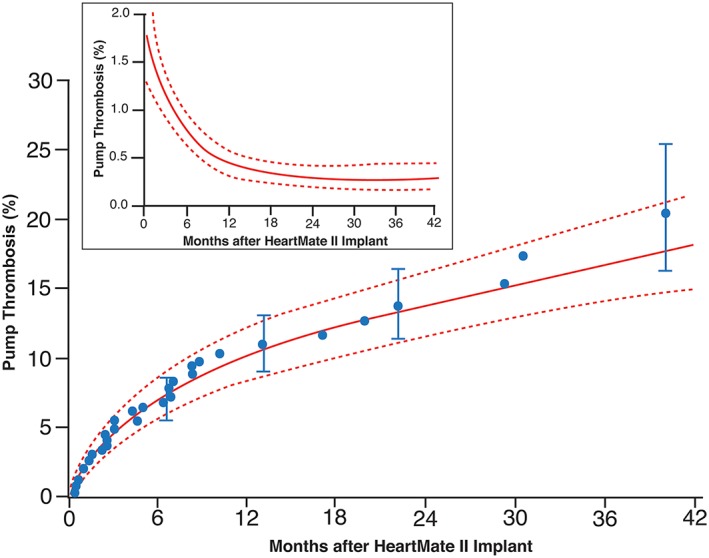
Figure 2.

Overall probability of pump thrombosis. Each symbol represents a pump thrombosis positioned on the vertical axis by the Kaplan–Meier estimator. Vertical bars are confidence limits equivalent to ±1 standard error. Solid lines are parametric hazard estimates enclosed within dashed 68% confidence bands equivalent to ±1 standard error. The inset shows instantaneous risk of pump thrombosis (hazard function) after HeartMate II implantation. Solid lines are parametric hazard estimates enclosed within dashed 68% confidence bands equivalent to ±1 standard error.
