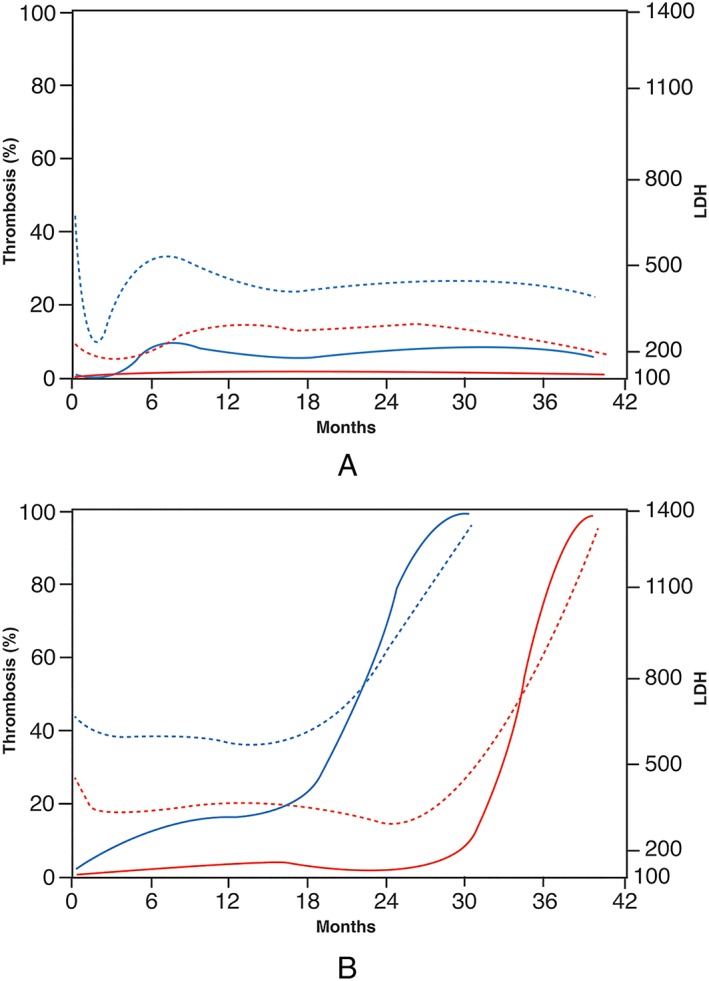
Figure 3.

Smoothed lactate dehydrogenase (LDH) trends and modelled probability of pump thrombosis for two pairs of HeartMate II devices. One device is illustrated in blue, the other in red. Dashed lines represent LDH trends and solid lines the corresponding probability of pump thrombosis. (A) Two devices that did not experience pump thrombosis. The device in red illustrates the very low probability of thrombosis with continuous low LDH values, while the device in blue shows a mild increase coinciding with uptrending in LDH around 3 months post‐implant. Notably, the model did not respond to increased LDH values in the first month post‐implant. (B) Two devices that experienced pump thrombosis. The device in red shows a low probability of pump thrombosis with stable LDH values, with sharply increasing probability matching a steep increase in LDH values beginning at 30 months. The device in blue shows moderate risk of pump thrombosis while LDH trends around 600 IU/L, with increasing probability matching a steep increase at 18 months post‐implant.
