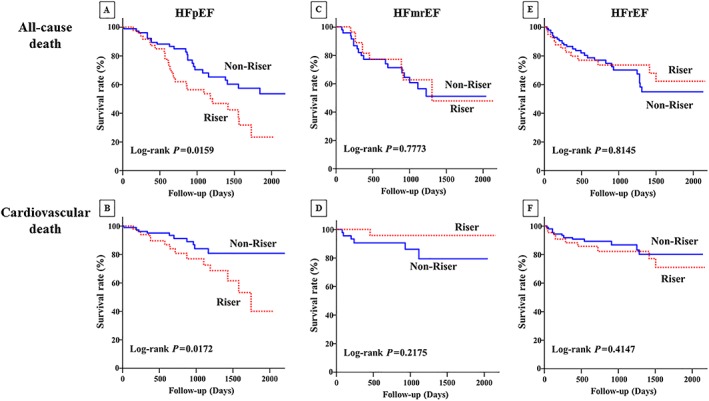
Figure 3.

Kaplan–Meier event‐free survival curves for (A) all‐cause death and (B) cardiovascular death in patients with HFpEF, (C) all‐cause death and (D) cardiovascular death in patients with HFmrEF, and (E) all‐cause death and (F) cardiovascular death in patients with HFrEF in the riser group (dotted line) compared with the non‐riser group (solid line). HFmrEF, heart failure with mid‐range ejection fraction; HFpEF, heart failure with preserved ejection fraction; HFrEF, heart failure with reduced ejection fraction.
