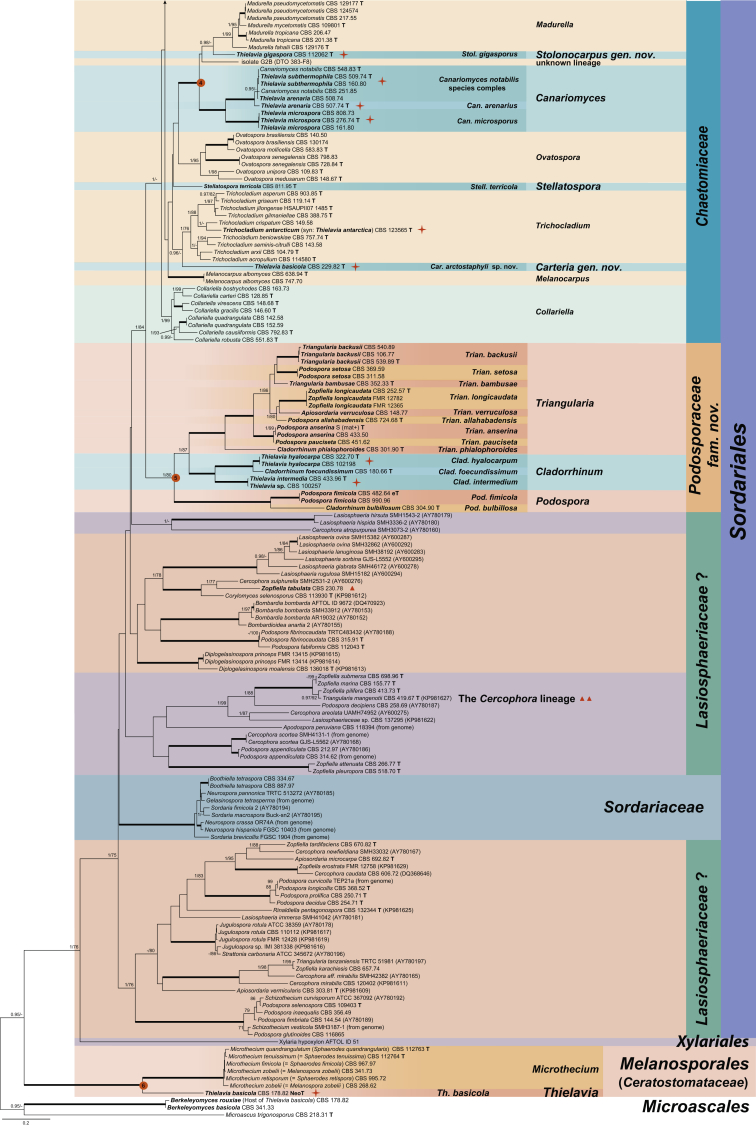
Fig. 2.
Phylogenetic tree inferred from ML analysis of the partial rpb2 gene region alignment. The confidence values are indicated at the notes same to Fig. 1. Genus/species clades in the Chaetomiaceae and potential family/genus lineages in the other traditional family are discriminated with boxes in different colours. Type strains are marked with “T” after the culture number. “eT” or “NeoT” represents the ex-epitype or ex-neotype designated in the this study. Thielavia-like strains are indicated with a red star on its right side. The reference sequences retrieved from GenBank database or from the released genomic data were marked behind the strain numbers. The scale bar shows the expected number of changes per site. The tree is rooted with three species in the Microascales.


