Figure 1.
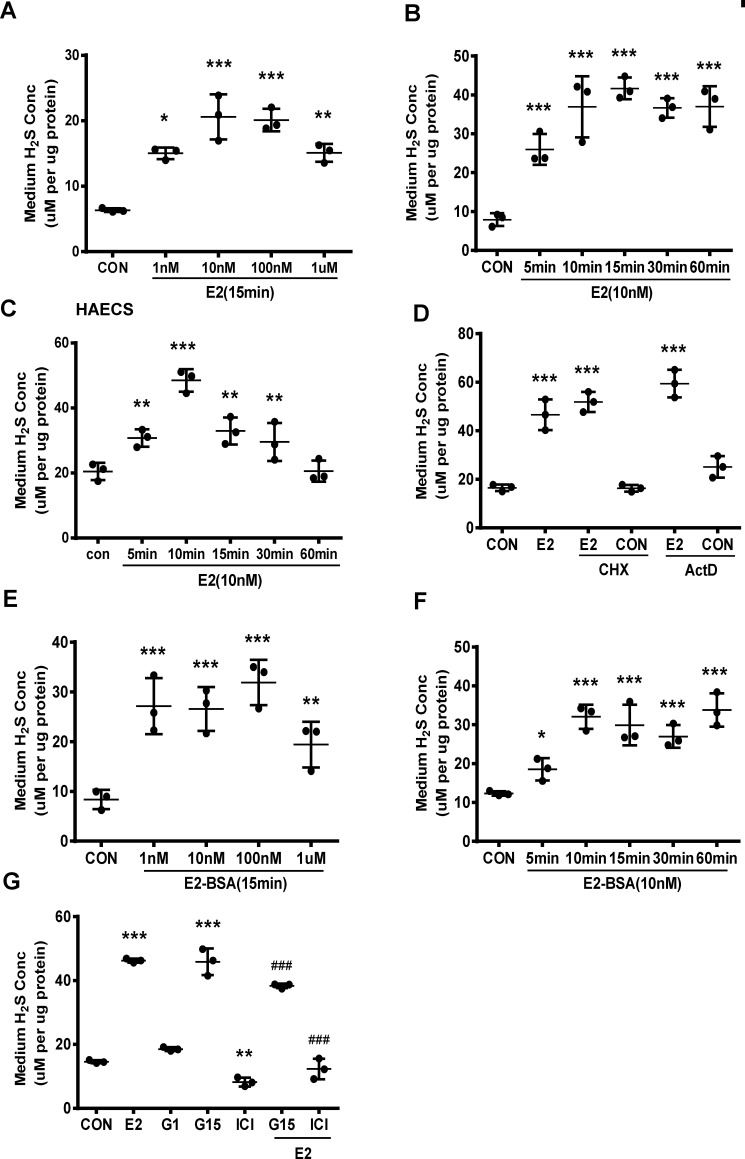
E2 promotes vascular endothelial H2S release through its nongenomic effect. A, HUVECs were exposed to different concentrations of E2 for 15 min, and the medium H2S concentrations were measured (mean ± S.D.; n = 3 independent experiments; *, p < 0.05; **, p < 0.01; ***, p < 0.001 versus CON, one-way ANOVA followed by the post hoc LSD test). B, HUVECs were treated with E2 (10 nm) at different time points, and the medium H2S concentrations were measured (mean ± S.D.; n = 3 independent experiments; ***, p < 0.001 versus CON; one-way ANOVA followed by the post hoc LSD test). C, HAECs were treated with E2 (10 nm) at different time points, and the medium H2S concentrations were measured (mean ± S.D.; n = 3 independent experiments; **, p < 0.01; ***, p < 0.001 versus CON; one-way ANOVA followed by the post hoc LSD test). D, HUVECs were treated with E2 in the presence or absence of the protein synthesis inhibitor CHX (200 μm) and the transcription inhibitor Act D (10 μm). The medium H2S concentrations were measured (mean ± S.D.; n = 3 independent experiments; ***, p < 0.001 versus CON; one-way ANOVA followed by the post hoc LSD test). E and F, HUVECs were treated with E2-BSA in different concentrations or at different time points, and the medium H2S concentrations were measured (mean ± S.D.; n = 3 independent experiments; *, p < 0.05; **, p < 0.01; ***, p < 0.001 versus CON; one-way ANOVA followed by the post hoc LSD test). G, HUVECs were treated with E2 in the presence or absence of ER antagonist ICI182,780 (ICI, 10 μm), GPR30 antagonist (G15, 10 μm), GPR30 agonist G1 (G1, 10 μm), and the medium H2S concentrations were measured (mean ± S.D.; n = 3 independent experiments; **, p < 0.01; ***, p < 0.001 versus CON; ###, p < 0.001 versus E2; one-way ANOVA followed by the post hoc LSD test).

