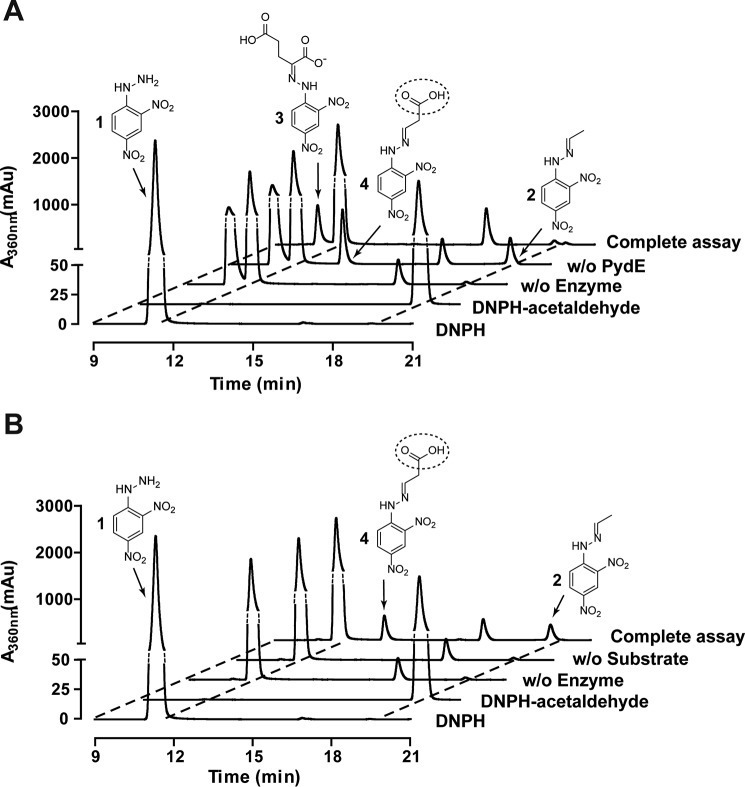
Figure 4.
LC/MS analyses of product formation in PydD- and PydE-catalyzed reactions. A, elution profiles of the LC/MS assays for the PydDE-catalyzed β-alanine degradation, monitoring the absorbance at 360 nm. The complete assay contains both PydD and PydE, and controls omitting both enzymes and omitting PydE are included. B, elution profiles of the LC/MS assays for PydE-catalyzed 3-HP oxidation, monitoring absorbance at 360 nm. Reaction products were derivatized with DNPH prior to LC/MS analyses. The break in the vertical axis of the plot is indicated in dotted lines.

