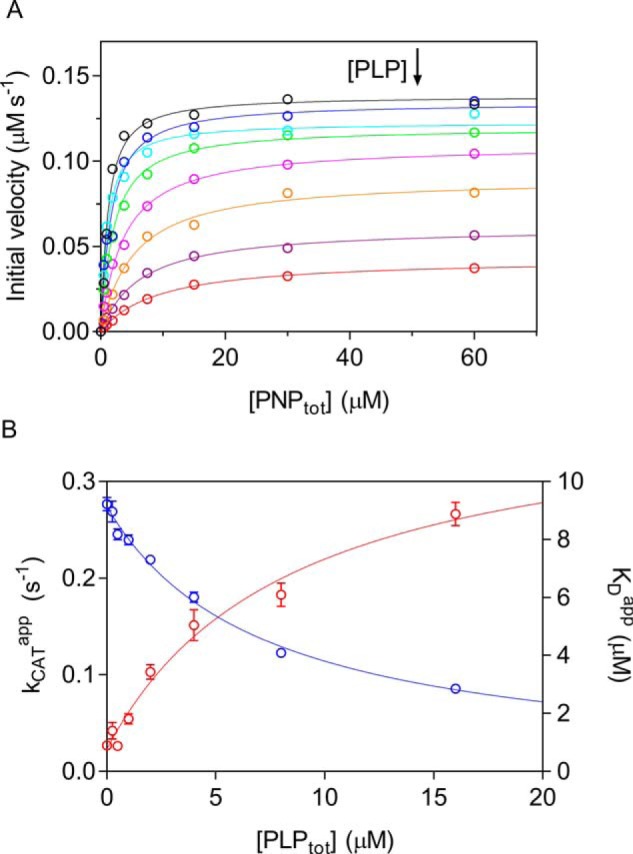
Figure 3.

Characterization of PLP inhibition. A, the initial velocity of the reaction was measured with 0.5 μm enzyme (protein subunit concentration), varying PNP concentration while keeping exogenous PLP fixed and at different concentrations (0, 0.25, 0.5, 1, 2, 4, 8, and 16 μm). The obtained saturation curves were fitted to Equation 2, obtaining estimates of apparent kcat and KD. B, fitting of apparent kcat (blue symbols) and KD (red symbols), using Equations 3–5, as explained under “Experimental procedures,” gave estimates of dissociation and inhibition constants, which are reported in Table 1. Error bars, S.E. of parameter values estimated in the fitting procedure. Concentration of PLP on x axes is the total concentration.
