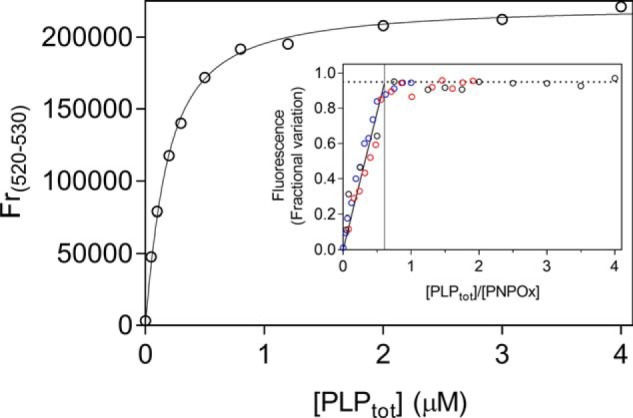
Figure 4.

Analysis of PLP-binding equilibrium. Emission spectra (from 470 and 570 nm) of PNPOx in the presence of different PLP concentrations were measured in 50 mm NaHEPES, pH 7.6, upon excitation at 450 nm. The figure shows the PLP-binding curve obtained with 100 nm PNPOx (protein subunit concentration). The average relative fluorescence emission between 520 and 530 nm (Fr(520–530)) as a function of total PLP concentration was analyzed with a quadratic equation describing the binding of a ligand at a single site (Equation 6), using the value of 100 nm protein subunit concentration as a fixed parameter in the fitting procedure. A dissociation constant of 147 ± 43 nm was calculated from the analysis of five independent experiments, such as that shown in the figure. Inset, binding stoichiometry analysis obtained with three different and much higher protein subunit concentrations (1 μm (black symbols), 2 μm (red symbols), and 4 μm (blue symbols)). Fluorescence change, expressed as fractional variation as a function of the [PLPtot]/[protein] ratio, is linear as shown by the thick continuous line, up to the stoichiometry point corresponding to the crossing with the horizontal dotted line. The vertical thin line through the stoichiometry point indicates that about one PLP molecule binds per enzyme dimer.
