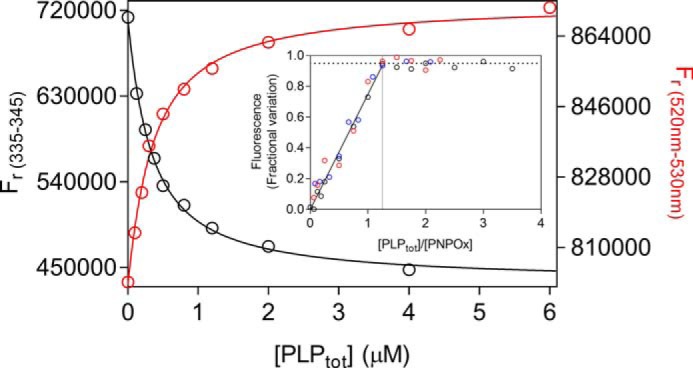
Figure 6.

PLP binding to enzyme forms with altered active site structure. Fluorometric analysis of PLP binding to apo-PNPOx (100 nm, protein subunit concentration) was carried out exciting at 280 nm. The average fluorescence emission between 335 and 345 nm was plotted against total PLP concentration (black symbols). PLP binding to the holo-form of the quadruple mutant (red symbols) was analyzed as described previously for WT holo-form PNPOx. Both sets of data were fitted using the quadratic Equation 6, obtaining KD values reported in Table 1. Inset, binding stoichiometry analysis obtained with three different and much higher concentrations of the quadruple PNPOx mutant, as explained in Fig. 4 for the WT enzyme. Protein subunit concentrations were 4 μm (black symbols), 8 μm (red symbols), and 12 μm (blue symbols).
