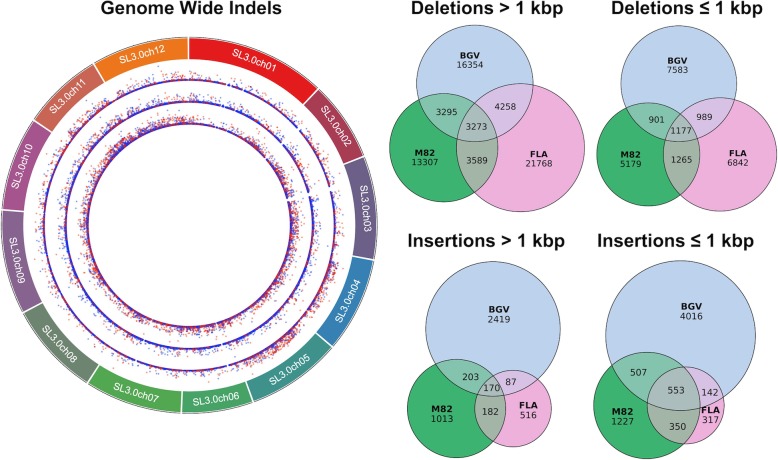
Fig. 5.
The tomato pan-genome. (left) Circos plot (http://omgenomics.com/circa/) depicting the size and type of structural variant. From the outer ring to the inner ring: M82, FLA, and BGV. Point height (y-axis) is scaled by the size of the variant, with red indicating insertions and blue indicating deletions. (right) Euler diagrams (https://github.com/jolars/eulerr) depicting the insertions and deletions shared among the three accessions

