Abstract
We describe a new approach to fluorescence sensing based on measurements of steady-state anisotropies in the presence of reference fluorophores with known anisotropies. The basic concept is that the anisotropy of a mixture reflects a weighted average of the anisotropies of the emitting species. By use of reference fluorophores the starting anisotropy can be near zero, or near 0.9 for oriented films which contain the reference fluorophore. Changing intensities of the analyte result in changes in anisotropy. A wide dynamic range of anisotropies is available because of the freedom to select high or low starting values. Anisotropy-based sensing was demonstrated for pH using 6-carboxyfluorescein and for protein affinity or immunoassay using an oriented film with high anisotropy and a protein labeled with a metal-ligand complex. The latter measurements were performed with a simple light-emitting diode excitation source without an excitation polarizer. The sensitive range of the assay can be adjusted by changing the intensity of the reference fluorophore. Anisotropy-based sensing can have numerous applications in clinical and analytical chemistry.
The technology for chemical-sensing fluorescence is advancing rapidly due to the continued introduction of new concepts, new fluorophores, and proteins engineered for sensing-specific analytes (1–7). New approaches to chemical sensing include lifetime-based sensing (8–10) and the use of metal–ligand complexes with microsecond decay times (11, 12). During the past year there has been an increased interest in the use of reference fluorophores as part of the sensor design. The basic idea is to mix the sensing fluorophore with another fluorophore which is not sensitive to the analyte. The combined emission from both species is used to determine the concentration of the analyte. This approach has been used with a long-lifetime reference and phase-angle measurements to develop sensors for pH and pCO2 (13, 14). In this laboratory we used such mixtures with modulation measurements for chemical sensing (15–17). When the sensor contains a mixture of fluorophores with nanosecond and microsecond decay times, the modulation of the emission, at appropriate low frequencies, becomes equal to the fractional intensity of the nanosecond fluorophore. This approach was used to develop sensors for glucose, pH, and calcium (15–17).
In the present report we describe another approach to sensing based on the use of reference fluorophores. This new method is based on the anisotropy of the reference, rather than its decay time. The sensor is designed so that one observes emission from both the sensing fluorophore and a reference fluorophore. The reference fluorophore can display an anisotropy near zero or can be near unity for fluorophores embedded in oriented films. The only requirements for sensing are that the sensing fluorophore change concentration or intensity and that it displays an anisotropy different from the reference. Under these conditions the analyte concentrations can be determined from a simple measurement of the steady-state anisotropy. The validity of this approach to sensing was demonstrated with an anisotropy pH sensor based on 6-carboxyfluorescein and for a protein-binding sensor based on human serum albumin labeled with a long-lifetime metal–ligand complex.
THEORY
The theory for anisotropy sensing is simple and is based on the additivity property of anisotropies demonstrated by Jabłoński (18). Suppose one observes the steady-state emission from two species, the sensing fluorophore which is sensitive to the analyte (S) and the reference fluorophore which is not sensitive to analyte (R). The measured anisotropy (r) is given by the intensity-weighted average of the individual anisotropies
| [1] |
In this expression fS and fR are the fractional intensities of the two species, fS + fR = 1.0. The intensity and anisotropy of the reference fluorophore is independent of the analyte. Any factor which results in a changing intensity of the sensing fluorophore will result in a change in the measured anisotropy. Hence, this approach to sensing can be used to detect the presence of any analyte which causes a change in intensity of the sensing fluorophore. A large number of fluorophores are known to change intensity in response to cations, anions, and various other analytes (5, 10).
The advantage of anisotropy sensing can be seen by considering an anisotropy assay based on protein–protein interactions. Suppose a fluorophore with a lifetime τ = 10 ns is bound to a protein with a rotational correlation time θ = 5 ns and that the fluorophore is rigidly bound to the protein. Assuming the fundamental anisotropy r0 = 0.4, the steady-state anisotropy of the labeled protein is given by the Perrin equation,
| [2] |
which in this case is equal to 0.133. Now suppose the labeled protein binds to a larger protein such that the correlation time increases to 40 ns. The steady-state anisotropy will then increase to r = 0.32. The total anisotropy change will thus be 0.19. The actual changes in anisotropy are often smaller than 0.19 due to r0 values less than 0.4 and segmental motion of the fluorophore on the protein.
An anisotropy assay using a reference fluorophore can have a much wider range of anisotropy values. This is because the reference fluorophore can be chosen to have an anisotropy near zero or near one. Anisotropies near zero are easily obtained for fluorophores with nanosecond lifetimes in aqueous solutions. Correlation times for fluorophores in water are near 100 ps, so any lifetime above 1 ns results in nearly complete depolarization. Also, the luminescent metal–ligand complexes have lifetimes of hundreds of nanoseconds to several microseconds (19, 20), and thus display anisotropies of zero when dissolved in water.
In addition to a zero anisotropy reference, one can also easily obtain a reference signal with an anisotropy near unity. Such values can be obtained for fluorophores in stretched polymer films, which results in elongated fluorophores being aligned along the stretching axis (21). In such systems the electronic transitions of the fluorophore are all aligned in one direction, or more precisely display a uniaxial orientation. The emission anisotropy from such samples is typically in the range of 0.6 to 0.8 and can approach 1.0 (22, 23). Stretched polymer films are easy to prepare and retain their orientation for extended periods of time. Hence, the use of a reference fluorophore and anisotropy sensing can expand the dynamic range of anisotropy values from 0.0 to 1.0, compared with a typical range of less than 0.2 anisotropy units.
MATERIALS AND METHODS
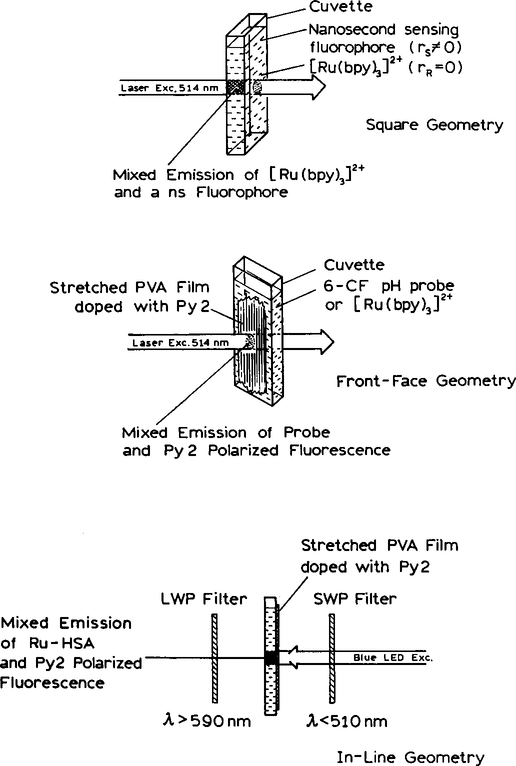
All experiments were performed using sensors configured as shown in Scheme 1. Excitation was with the 514-nm output of an air-cooled argon ion laser or with a blue light-emitting diode (LED)1 from Nichia Chemical Industries (Tokushima, Japan). When using a LED, an excitation bandpass of 466 ± 26 nm was selected (24) using a 510-nm short wavepass filter. The laser excitation was vertically polarized, and the emission observed through a polarizer oriented parallel (∥) or perpendicular (⊥) to the electric vector of the excitation. For experiments with the LED excitation source we did not use an excitation polarizer. When using an oriented film there is no need to use an excitation polarizer because the emission is highly polarized with polarized or unpolarized excitation. The anisotropy is given by
| [3] |
where I∥ and I⊥ are the intensities observed with the emission polarizer parallel or perpendicular to the polarized excitation, respectively. The G factor is the ratio of intensities (I∥/I⊥) observed with horizontally polarized excitation (25). In our apparatus the G factor was near 1.0. For experiments without an excitation polarizer we used the G factor measured with an excitation polarizer. This is acceptable because the G factor is a property of the detection system and not dependent on the method of excitation.
SCHEME 1.
Schematic of the anisotropy sensors with a zero anisotropy (top) or a high anisotropy reference (middle and bottom). When using an oriented film as the reference, excitation can be performed without a polarizer (bottom).
Erythrosin B was obtained from BDH, [Ru(bpy)3]2+ was obtained from GFS Chemicals, and 6-carboxy fluorescein from Eastman Kodak and used without further purification. Pyridine 2 (Py2) was obtained from Exciton, Inc. Films of polyvinyl alcohol were prepared as described previously (22, 23). These films were stretched up to sixfold to orient the Py2 molecules and the film was then pressed against the side of the cuvette (Scheme I). When using stretched films the stretching ratio (RS) is defined as the axial ratio a/b of an ellipse which is formed when stretching an imaginary circle in the unoriented film (23). The volume of the ellipse is assumed to be conserved. Under these conditions
| [4] |
where N is the physical fold of the stretch.
The sulfhydryl reactive ruthenium metal–ligand complex [Ru(bpy)2(phen-IA)](PF6)2 was prepared as described previously (26). Human serum albumin was labeled using a fivefold molar excess of this complex in phosphate buffer, pH 7.1, overnight at 4°C. Unreacted dye was removed with a Sephadex G-15 column, followed by dialysis overnight against phosphate-buffered saline. The dye-to-protein molar ratio was near 0.40, as determined using the molar extinction coefficient for HSA of 3.7 × 10⁴ M−1 cm−1 at 280 nm and 64,500 and 16,600 M−1 cm−1 for the ruthenium complex at 280 and 450 nm, respectively. However, only labeled protein is observed in this experiment, so the effective dye-to-protein ratio is near 1.0.
RESULTS
Model Study with a Fluorophore Mixture
The concept of anisotropy sensing was tested using a mixture of fluorophores. We chose [Ru(bpy)3]2+ as the reference. The decay time of this complex in water is near 400 ns, and its steady-state anisotropy is essentially zero, independent of the excitation wavelength. To model a sensing fluorophore with a nonzero anisotropy we chose erythrosin B. In water at 20°C this fluorophore displays a decay time of 75 ps (27). The short lifetime is expected to result in a nonzero anisotropy. Erythrosin B was also chosen because it could be excited with the same 514-nm laser and displays a high fundamental anisotropy r0 near 0.4 at this wavelength (27).
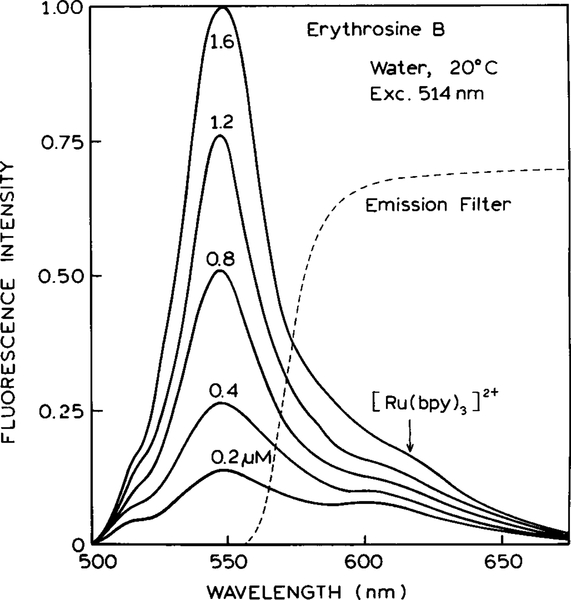
Emission spectra of the ErB-[Ru(bpy)3]2+ mixture are shown in Fig. 1. The emission centered at 550 nm is due to ErB and increases as the ErB concentration increases. The shoulder at 620 nm is due to [Ru(bpy)3]2+, which is present at the same concentration for all these emission spectra. For anisotropy sensing the combined emission of ErB and [Ru(bpy)3]2+ was observed through a filter whose transmission is shown in Fig. 1 (- - -). This filter attenuated the emission of ErB relative to that of the reference so that both fluorophores made comparable contributions to the detected emission.
FIG. 1.
Emission spectra of erythrosin B in water at 20°C in the presence of the [Ru(bpy)3]2+ reference. The dashed line shows the transmission of the emission filter used for the anisotropy measurements.
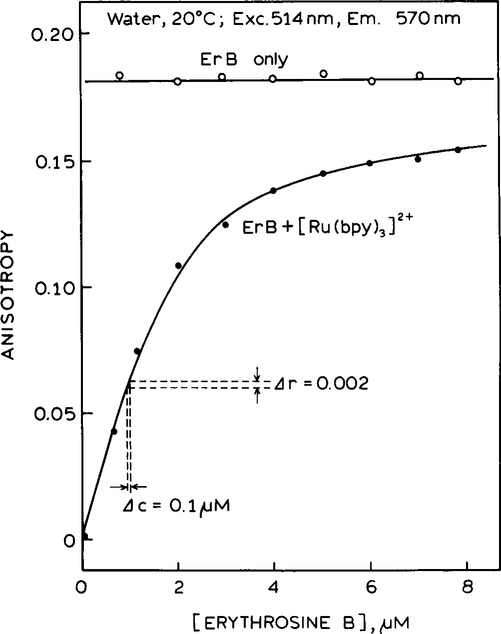
Steady-state anisotropies for this sensor are shown in Fig. 2. For ErB alone, without [Ru(bpy)3]2+, the anisotropy is independent of the ErB concentration (◯) and displays a constant value of 0.18. For the mixture the anisotropy is strongly dependent on the ErB concentration. At low ErB concentrations the anisotropy is near zero because the [Ru(bpy)3]2+ has an anisotropy near zero. The anisotropy increased dramatically as the ErB concentration increases relative to that of [Ru(bpy)3]2+.
FIG. 2.
Concentration dependence of the steady-state anisotropy of ErB, in the absence (◯) and presence (●) of the [Ru(bpy)3]2+ reference. Anisotropies were measured using the emission filter shown in Fig. 1 (- - -).
The data for the ErB–[Ru(bpy)3]2+ mixture are presented in Table 1, along with a comparison of the expected and calculated fractional intensities. The anisotropy of the mixture was used to calculate the fractional intensity of ErB. These calculated values are in excellent agreement with the fractional intensities found from the intensity measurements on the control samples containing a single fluorophore. These results (Fig. 1 and Table 1) demonstrate that anisotropy sensing can be used with any sensing fluorophore which displays an intensity change in response to an analyte and a nonzero anisotropy.
TABLE 1.
Steady-State Intensities and Anisotropies for the Erythrosin B–[Ru(bpy)3]2+ Mixture in Water at 20°C
| [ErB] (μM) | [Ru(bpy)3]2+ (μM) |
ITa | fErBb | r | c |
|---|---|---|---|---|---|
| 0 | 20 | 1275 | 0 | 0 | 0 |
| 0.5 | 20 | 1720 | 0.258 | 0.043 | 0.237 |
| 1 | 20 | 2250 | 0.433 | 0.075 | 0.414 |
| 2 | 20 | 3234 | 0.606 | 0.109 | 0.602 |
| 3 | 20 | 4081 | 0.687 | 0.122 | 0.674 |
| 4 | 20 | 5080 | 0.749 | 0.138 | 0.762 |
| 5 | 20 | 6035 | 0.789 | 0.144 | 0.796 |
| 6 | 20 | 7040 | 0.819 | 0.147 | 0.812 |
| 7 | 20 | 7705 | 0.834 | 0.149 | 0.823 |
| 8 | 20 | 8570 | 0.851 | 0.153 | 0.845 |
Total fluorescence intensity, IT = I∥ + 2I⊥.
Fractional intensity of ErB. This value was calculated using fErB = (I − IR)/I, where IR is the intensity of the [Ru(bpy)3]2+ in the absence of ErB.
Fractional intensity of ErB calculated from the anisotropy data. This value was calculated using , where rs is the anisotropy of ErB in the absence of [Ru(bpy)3]2+
Oriented Film as the Anisotropy Reference
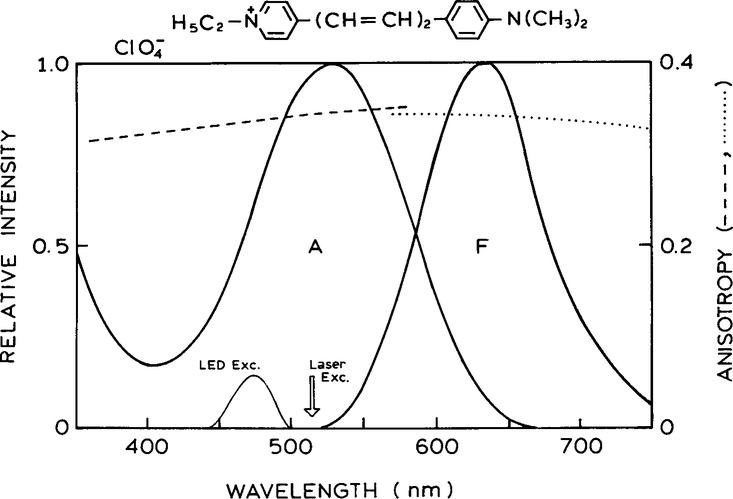
Another approach to anisotropy-based sensing makes use of the high anisotropy values available from oriented systems. Oriented samples can be easily prepared by the use of stretched polymer films (21–23). We chose the laser dye Py2 because of its favorable spectral properties. Absorbtion and emission spectra of Py2 in a PVA film are shown in Fig. 3. Py2 can be excited at 514 nm and displays a reasonable Stokes’ shift. Importantly, Py2 displays a high fundamental anisotropy which is mostly independent of the excitation and emission wavelengths.
FIG. 3.
Absorption and emission spectra of pyridine 2 in a polyvinyl alcohol film. Also shown are the excitation (- - -) and emission (…) anisotropy spectra.
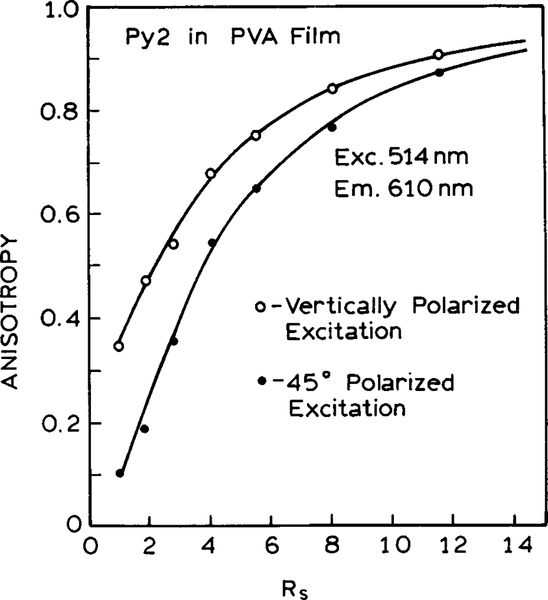
The anisotropy of Py2 in the PVA film can be increased dramatically by mechanical stretching. As the stretching ratio is increased, the anisotropy increases from 0.34 for the unoriented film to nearly 0.9 for a film which has been stretched five- to sixfold (Fig. 4). The use of a stretched film can eliminate the need for an excitation polarizer and thus decrease the cost and complexity of the instrument. This is shown by comparing the anisotropy values for the Py2–PVA film observed with polarized and unpolarized excitation (Fig. 4). To be more precise, we mimicked unpolarized excitation with a beam rotator, so that the electric vector of the excitation was 45° from the vertical orientation. For the unstretched film the anisotropy with 45° excitation is one-half of that found for vertically polarized excitation, which agrees with the values expected for the theory of anisotropy (25).
FIG. 4.
Fluorescence anisotropy as a function of stretching. Rs is the stretching ratio. Rs = N3/2 where N is the fold of the stretch (23).
It is important to notice the dependence of the anisotropies as the PVA film is stretched, with polarized and unpolarized excitation. For unpolarized excitation the anisotropy increases more rapidly with stretching than for polarized excitation (Fig. 4). At high stretching ratios the anisotropies are nearly equal independent of whether the excitation is polarized or unpolarized. This occurs because the electronic transitions are oriented along the vertical axis. Hence, the emission is polarized along this axis even if the excitation is unpolarized or polarized at 45°C from the vertical. Hence, the oriented film serves the same purpose of an excitation polarizer and results in alignment of the electronic transitions with the vertical axis.
Anisotropy pH Sensing with Oriented Films
As a second example of anisotropy sensing we chose to develop a pH sensor using the oriented film as a reference. We chose 6-carboxyfluorescein as a pH-sensitive fluorophore. Fluorescein has been widely used for pH sensing (28–30). Fluorescein and its derivatives display a pH-dependent dissociation of the carboxyl group. The ionized form which exists at pH values above 7.5 is highly fluorescent, and the protonated low-pH form is essentially nonfluorescent. Hence, the intensity of fluorescein increases over the pH range from 5 to 7.
Since fluorescein displays a lifetime near 4 ns, its anisotropy in water is expected to be near zero. Hence, we could not use the zero anisotropy reference [Ru(bpy)3]2+. We used the high anisotropy reference, Py2 in a stretched PVA film. For these experiments the PVA film was stretched 5.5-fold and displayed anisotropy near 0.9. This value is above the usual theoretical limit of 0.4 because this latter value applies to randomly distributed fluorophores.
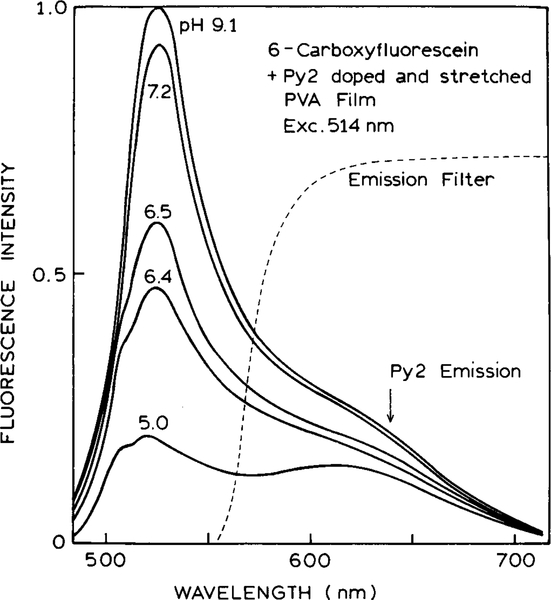
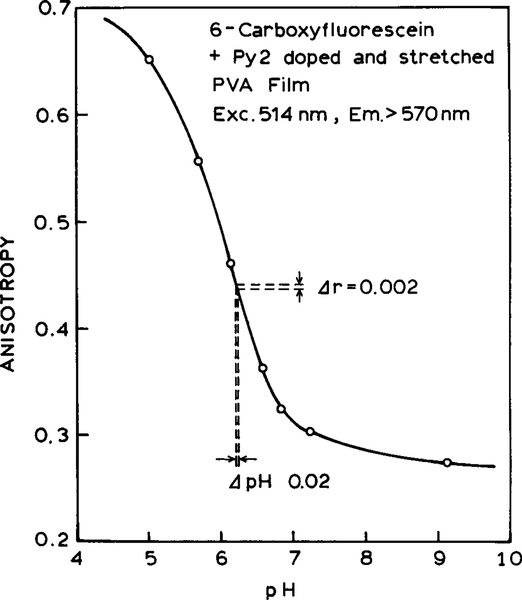
Emission spectra of the Py2–6-CF pH sensor are shown in Fig. 5. The same fluorescein concentration is present for all spectra, but the pH is varied. As the pH increases so does the intensity of the fluorescein relative to that of the Py2–PVA reference. Anisotropies are shown in Fig. 6. As the pH increases, the anisotropy decreases. At low pH the anisotropies exceed 0.4 because of the high anisotropy from the Py2–PVA film. Anisotropy measurements are readily accurate to ±0.002. For this degree of accuracy, the pH is expected to be accurate to ±0.02, which is adequate for clinical measurement of pH as done for blood gas determination (31–33).
FIG. 5.
Emission spectra of the high-anisotropy PVA film in the presence of 6-carboxyfluorescein at various pH values.
FIG. 6.
pH sensor based on 6-carboxyfluorescein and the Py2–PVA film.
These results demonstrated that any sensing fluorophore which displays a change in intensity can be used to create an anisotropy-based sensor. Fluorophores displaying intensity changes are known for a wide variety of ions, including sodium, potassium, calcium, magnesium, zinc, chloride, phosphate, and oxygen (10, 34–44). Additionally, one can imagine film-type sensors which contain the high anisotropy reference and an immobilized sensing fluorophore. The anisotropy of such sheet-type sensors could be used for determination of ion concentrations in a wide variety of situations.
Anisotropy Sensing of Protein Binding: Front-Face Geometry
Binding of proteins to surfaces is used in a wide variety of biomedical assays (45). Hence, we considered how anisotropy-based sensing could be used to detect the presence of labeled proteins near surfaces. This situation was modeled using the stretched film and a long-lifetime metal–ligand complex in water. We selected this model system because there has been significant progress in the design and synthesis of conjugatable MLCs with long lifetimes in aqueous solution (11, 46, 47). While the emission of MLC-labeled proteins is usually polarized, the anisotropies are often low. Hence the most promising approach appears to be the decrease in anisotropy expected from the combined emission of a MLC and the Py2–PVA film. In this experiment we used front-face geometry (Scheme I, middle).
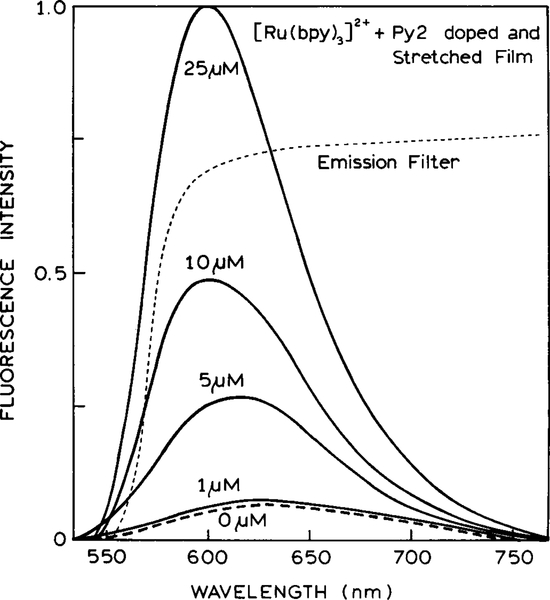
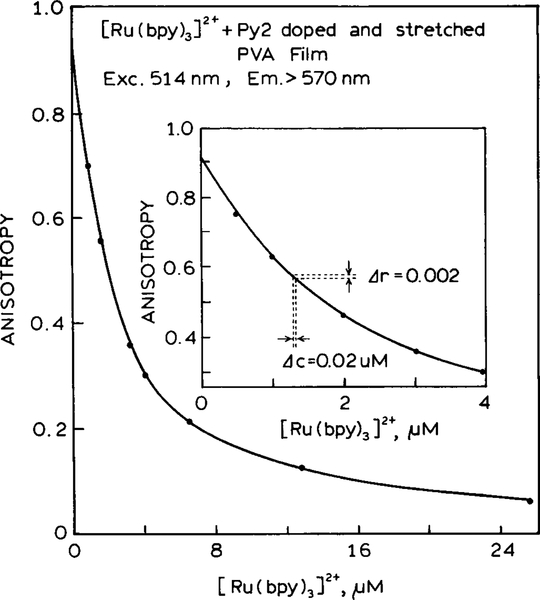
To test this concept we examined the Py2–PVA film in the presence of increasing amounts of [Ru(bpy)3]2+. Emission spectra for the Py2–PVA film and [Ru(bpy)3]2+ are shown in Fig. 7. In this case the emission spectra overlap strongly, and one cannot easily identify the two species in the spectra. The intensity of the emission at 600 nm increases as the [Ru(bpy)3]2+ concentration increases. The anisotropy decreases rapidly as the [Ru(bpy)3]2+ concentration increases (Fig. 8). The anisotropies seem to be particularly sensitive to low concentrations of the Ru complex.
FIG. 7.
Emission spectra of the Py2–PVA film in the presence of increasing concentrations of [Ru(bpy)3]2+.
FIG. 8.
Steady-state anisotropy of the Py2–PVA–[Ru(bpy)3]2+ sensor with increasing concentrations of [Ru(bpy)3]2+.
Protein Binding with LED Excitation: In-Line Geometry
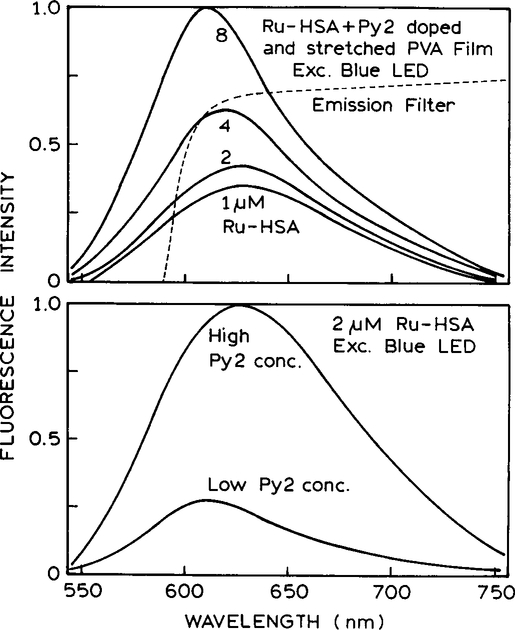
We imagine that anisotropy sensing will be a useful way to detect protein binding to surfaces. For instance, the Py2–PVA surface may contain antibodies for a desired antigen, and the assay mixture may include a Ru-labeled antigen. In such a case the concentration of Ru-labeled protein near the surface would depend on the antigen concentration in the sample, as is typical in a competitive assay. We tested the feasibility of such a sensor using HSA labeled with [Ru(bpy)2 (phen-IA)]2+ (Fig. 9). In this case we varied the concentration of Py2 in the PVA (bottom) film as well as the bulk concentration of Ru-labeled HSA (Ru-HSA) (top). These measurements were done using the in-line geometry (Scheme I, bottom), which is comparable to a front-face measurement. For these cases the anisotropy, or more priority polarization, from an isotropic sample is always zero, even if nonzero for right-angle observation. However, the anisotropy of the oriented film is high with front-face and in-line observations.
FIG. 9.
(Top) Emission spectra of the Py2–PVA film with increasing concentrations of Ru-HSA. (Bottom) Emission spectra with different concentrations of Py2 in the film and the same concentration of Ru-HSA.
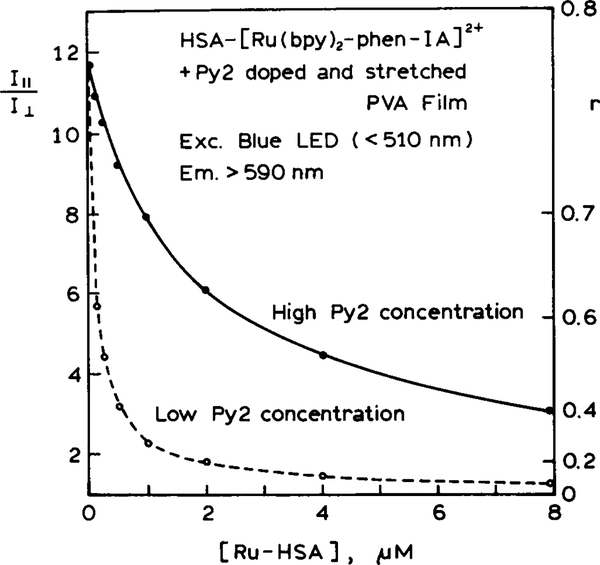
The anisotropy data for this model sensor are shown in Fig. 10. The anisotropy decreases rapidly with increasing concentrations of Ru-HSA. It is important to notice that the sensitivity range of the assay can be adjusted by changing the concentration of Py2 in the PVA film. A lower concentration of Py2 results in a greater sensitivity to lower concentrations of Ru-HSA (- - -). For such assays it is not necessary to calculate the anisotropy. If desired, one can use the ratio of the polarized intensities. While the present measurements were performed with excitation of the bulk phase, one can also imagine situations where excitation is accomplished under conditions of total internal reflectance. Total internal reflectance fluorescence has been widely used for sensing and surface imaging (48–50). Under these conditions the excited volume of the aqueous phase would penetrate into the solution only to a distance comparable to the wavelength.
FIG. 10.
Steady-state anisotropy of the Py2–PVA film with increasing concentrations of Ru-HSA.
DISCUSSION
What are the advantages of anisotropy-based sensing? One advantage is that anisotropy measurements are intrinsically ratiometric and provide an absolute value which can be readily compared between instruments. A further advantage is that any sensing fluorophore which changes intensity can be used with our method, thus changing an intensity measurement to a ratiometric anisotropy measurement. The use of a reference fluorophore expands the dynamic range of the anisotropy to almost one full unit, 0.0 to 1.0. While most of the results in this paper were presented in terms of the anisotropy, calculation of the anisotropy is not required. For an analytical or clinical application the ratio I∥/I⊥ can be used directly for the calibration curve.
One disadvantage of our approach is that the analyte calibration curve will depend on the concentrations of the sensing and reference fluorophores and on the excitation and emission wavelengths. This situation may be improved by covalent linkage of the fluorophores to each other or to the supporting matrices. We expect anisotropy-based sensing to provide a valuable method for clinical chemistry, where the measurements must be accomplished with high accuracy and with simple and/or portable instruments.
ACKNOWLEDGMENT
This work was supported by a grant from the National Institutes of Health National Center for Research Resources RR-08119.
Footnotes
Abbreviations used: ErB, erythrosin B; Py2, pyridine 2; PVA, polyvinyl alcohol; 6-CF, 6-carboxyfluorescein; HSA, human serum albumin; bpy, 2,2′-bipyridyl; phen-IA, 5-iodoacetamido-1,10-phenan-throline; Ru-HSA, HSA covalently labeled with [Ru(bpy)2(phen-IA)](PF6)2; LED, light-emitting diode; MLC, metal–ligand complex.
REFERENCES
- 1.Wolfbeis OS (Ed.) (1991) Fiber Optic Chemical Sensors and Biosensors, Vol. I, CRC Press, Boca Raton, FL. [Google Scholar]
- 2.Wolfbeis OS (Ed.) (1991) Fiber Optic Chemical Sensors and Biosensors, Vol. II, CRC Press, Boca Raton, FL. [Google Scholar]
- 3.Spichiger-Keller UE (1998) Chemical Sensors and Biosensors for Medical and Biological Applications, Wiley-VCH, New York. [Google Scholar]
- 4.Schulman SG (Ed.) (1993) Molecular Luminescence Spectroscopy, Methods and Applications: Part 3, Wiley, New York. [Google Scholar]
- 5.Lakowicz JR (Ed.) (1994) Topics in Fluorescence Spectroscopy, Vol. 4, Probe Design and Chemical Sensing, Plenum, New York. [Google Scholar]
- 6.Kunz RE (Ed.) (1997) Sensors Actuators B B38, 1–188, and B39, 1–468. [Google Scholar]
- 7.Thompson RB (Ed.) (1997) Adv. Fluoresc. Sensing Technol. III, SPIE Proc, 2980, 582. [Google Scholar]
- 8.Lippitsch ME, Draxler S, and Kieslinger D (1997) Sensors Actuators B 38–39, 96–102. [Google Scholar]
- 9.Lippitsch ME, Pusterhofer J, Leiner MJP, and Wolfbeis OS (1988) Anal. Chim. Acta 205, 1–6. [Google Scholar]
- 10.Szmacinski H, and Lakowicz JR (1994) in Topics in Fluorescence Spectroscopy Vol. 4, Probe Design and Chemical Sensing (Lakowicz JR, Ed.), pp. 295–334, Plenum, New York. [Google Scholar]
- 11.Terpetschnig E, Szmacinski H, and Lakowicz JR (1997) Methods Enzymol, 295–321. [DOI] [PubMed] [Google Scholar]
- 12.Szmacinski H, Castellano FN, Terpetschnig E, Dattelbaum JD, Lakowicz JR, and Meyer GJ (1997) Biochim. Biophys. Acta 1383, 151–159. [DOI] [PubMed] [Google Scholar]
- 13.Neurauter G, Klimant I, Liebsch G, Kosch U, and Wolfbeis OS (1998) Europt(r)ode IV, 231–232. [Google Scholar]
- 14.Klimant I, and Wolfbeis OS (1998) Europt(r)ode IV, 125–126. [Google Scholar]
- 15.Tolosa L, Gryczynski I, Eichhorn L, Dattelbaum JD, Castellano FN, Rao G, and Lakowicz JR (1998) Anal. Biochem, in press. [DOI] [PMC free article] [PubMed] [Google Scholar]
- 16.Lakowicz JR, Castellano FN, Dattelbaum JD, Tolosa L, Rao G, and Gryczynski I (1998) Anal. Biochem, 70, 5115–5121. [DOI] [PMC free article] [PubMed] [Google Scholar]
- 17.Lakowicz JR, Dattelbaum JD, and Gryczynski I (1998) Submitted for publication.
- 18.Jabłoński A (1960) Bull. Acad. Pol. Sci 8, 259–264. [Google Scholar]
- 19.Sacksteder LA, Lee M, Demas JN, and DeGraff BA (1993) J. Am. Chem. Soc 115, 8230–8238. [Google Scholar]
- 20.Juris A, and Balzani V (1988) Coord. Chem. Rev 84, 85–277. [Google Scholar]
- 21.Michl J, and Thulstrup EW (1986) Spectroscopy With Polarized Light, VCH, New York. [Google Scholar]
- 22.Kawski A, and Gryczynski Z (1987) Z. Naturforsch 42a, 617–621. [Google Scholar]
- 23.Kawski A, Gryczynski Z, Gryczynski I, Lakowicz JR, and Piszczek G (1996) Z. Naturforsch 51a, 1037–1041. [DOI] [PMC free article] [PubMed] [Google Scholar]
- 24.Sipior J, Carter GM, Lakowicz JR, and Rao G (1996) Rev. Sci. Instrum 67(11), 3795–3798. [Google Scholar]
- 25.Lakowicz JR (1999) Principles of Fluorescence Spectroscopy, 2nd ed, Plenum, New York, in press. [Google Scholar]
- 26.Castellano FN, Dattelbaum FN, and Lakowicz JR (1998) Anal. Biochem 255, 165–170. [DOI] [PubMed] [Google Scholar]
- 27.Matczuk A, Bojarski P, Gryczynski I, Kuśba J, Kulak L, and Bojarski C (1995) J. Photochem. Photobiol. A 90, 91–94. [Google Scholar]
- 28.Babcock DF (1983) J. Biol. Chem 258, 6380–6389. [PubMed] [Google Scholar]
- 29.Klonis N, Clayton AHA, Voss EW, and Sawyer WH (1998) Photochem. Photobiol 67, 500–510. [PubMed] [Google Scholar]
- 30.Haugland RP (Ed.) (1996) Molecular Probes Catalogue 6th ed, pp. 551–561. [Google Scholar]
- 31.Mahutte CK, Holody M, Maxwell TP, Chen PA, and Sasse SA (1994) Am. J. Respir. Crit. Care Med. 149, 852–859. [DOI] [PubMed] [Google Scholar]
- 32.Mahutte CK, Sasse SA, Chen PA, and Holody M (1994) Am. J. Respir. Crit. Care Med. 150, 865–869. [DOI] [PubMed] [Google Scholar]
- 33.Mahutte CK (1994) Intensive Care Med. 20, 85–86. [DOI] [PubMed] [Google Scholar]
- 34.Tsien RY (1989) in Methods in Cell Biology, pp. 127–156, Academic Press, New York. [DOI] [PubMed] [Google Scholar]
- 35.Kao JPY (1994) in Methods in Cell Biology, Vol. 40, pp. 155–181, Academic Press, New York. [DOI] [PubMed] [Google Scholar]
- 36.Lakowicz JR, Szmacinski H, and Johnson ML (1992) J. Fluoresc 2(1), 47–62. [DOI] [PMC free article] [PubMed] [Google Scholar]
- 37.Lakowicz JR, and Szmacinski H (1992) Sensors Actuators B 11, 133–143. [Google Scholar]
- 38.Kao JPY, Harootunian AT, and Tsien RY (1989) J. Biol. Chem 264, 8179–8184. [PubMed] [Google Scholar]
- 39.Valeur B (1994) in Topics in Fluorescence Spectroscopy, Vol. 4, Probe Design and Chemical Sensing (Lakowicz JR, Ed.), pp. 21–48, Plenum, New York. [Google Scholar]
- 40.Czarnik AW (1994) in Topics in Fluorescence Spectroscopy, Vol. 4, Probe Design and Chemical Sensing (Lakowicz JR, Ed.), pp. 49–70, Plenum, New York. [Google Scholar]
- 41.Verkman AS, Sellers MC, Chao AC, Leung T, and Ketcham R (1989) Anal. Biochem 178, 355–361. [DOI] [PubMed] [Google Scholar]
- 42.Biwersi J, Tulk B, and Verkman AS (1994) Anal. Biochem 219, 139–143. [DOI] [PubMed] [Google Scholar]
- 43.Bacon JR, and Demas JN (1987) Anal. Chem 59, 2780–2785. [Google Scholar]
- 44.Carraway ER, Demas JN, DeGraff BA, and Bacon JR (1991) Anal. Chem 63, 337–342. [Google Scholar]
- 45.Van Dyke K, and Van Dyke R (Eds.) (1990) Luminescence Immunoassay and Molecular Applications, CRC Press, Boca Raton, FL. [Google Scholar]
- 46.Guo X-Q, Castellano FN, Li L, and Lakowicz JR (1998) Anal. Chem 70(3), 632–637. [DOI] [PMC free article] [PubMed] [Google Scholar]
- 47.Guo X-G, Castellano FN, Li L, Szmacinski H, Lakowicz JR, and Sipior J (1997) Anal. Biochem 254, 179–186. [DOI] [PMC free article] [PubMed] [Google Scholar]
- 48.Axelrod D, Hellen EH, and Fulbright RM (1992) in Topics in Fluorescence Spectroscopy, Vol. 3, Biochemical Applications, pp. 289–343, Plenum, New York. [Google Scholar]
- 49.Zhou Y, Laybourn PJR, Magill JV, and De La Rue RM (1991) Biosensors Bioelectron. 6, 595–607. [DOI] [PubMed] [Google Scholar]
- 50.Olveczky BP, Periasamy N, and Verkman AS (1997) Biophys. J 73, 2836–2847. [DOI] [PMC free article] [PubMed] [Google Scholar]


