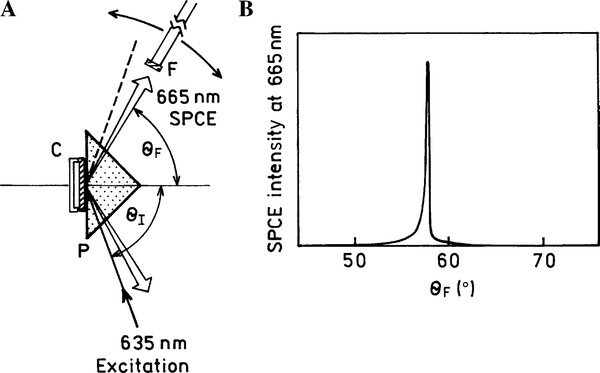
Fig. 1.
(A) Scheme of the SPCE measurement (left). The 635-nm beam excites the sample (AlexaFluor 647-labeled anti-rabbit antibodies bound to the rabbit IgG immobilized on the substrate surface) at the SPR angle θI (KR configuration). The SPCE of AlexaFluor 647 is emitted at the SPCE angle θF and is being detected with the fiber (F) equipped with a long wave pass filter and a 200-μm vertical air slit and connected to the SLM model 8000 spectrofluorometer. The fiber is positioned on the arm, which can be rotated around the stage. (B) Graph showing SPCE sharply concentrated around the θF angle (full width at half maximum [FWHM] ~0.5°).

