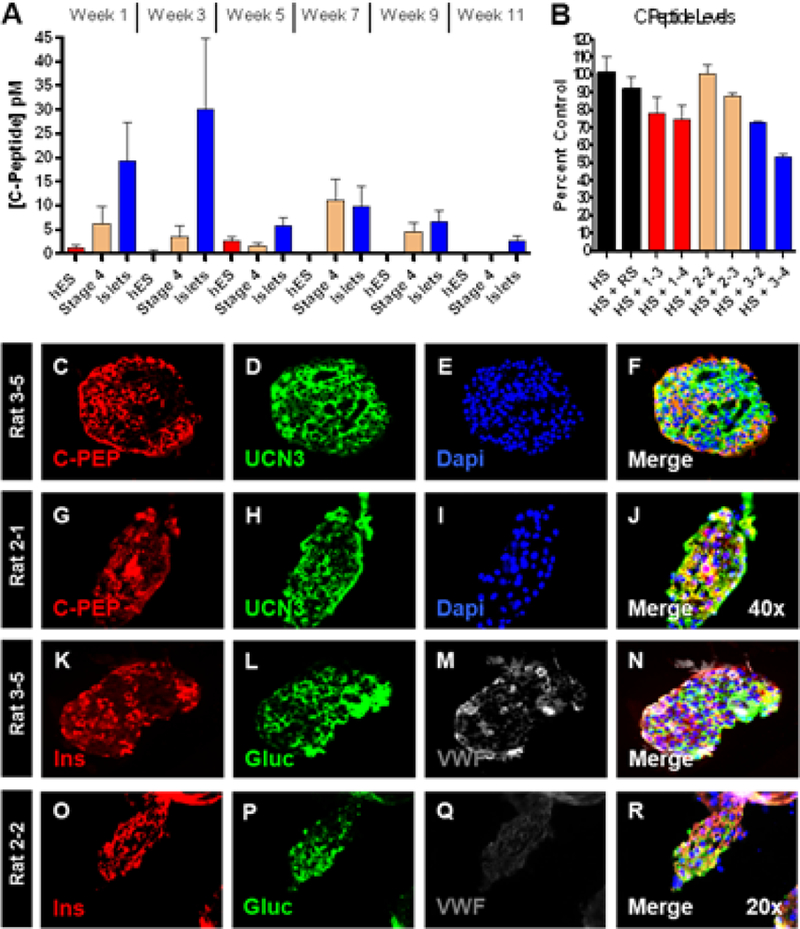
Figure 5 – In trial measurements and post-trial recovery.

Panel A shows the average biweekly serum hC-peptide concentration per group for the length of the trial. Panel B shows the depletion of C-peptide from human serum by serum from representative rats from the trial indicated on the x-axis. Abbreviations are as follows: human serum (HS), control rat serum (RS) and numbers are rat serum recovered from the indicated cohorts (ie 1–3 is rat 3 from group 1). Panels C-J show immunofluorescence staining for C-Peptide and Urocortin-3 on recovered islets (panels C-F) and hESC derivatives (panels G-J). Panels K-R show immunofluorescence staining for Insulin, Glucagon and Von Willebrand Factor on recovered islets (panels K-N) and hESC derivatives (panels O-R).
