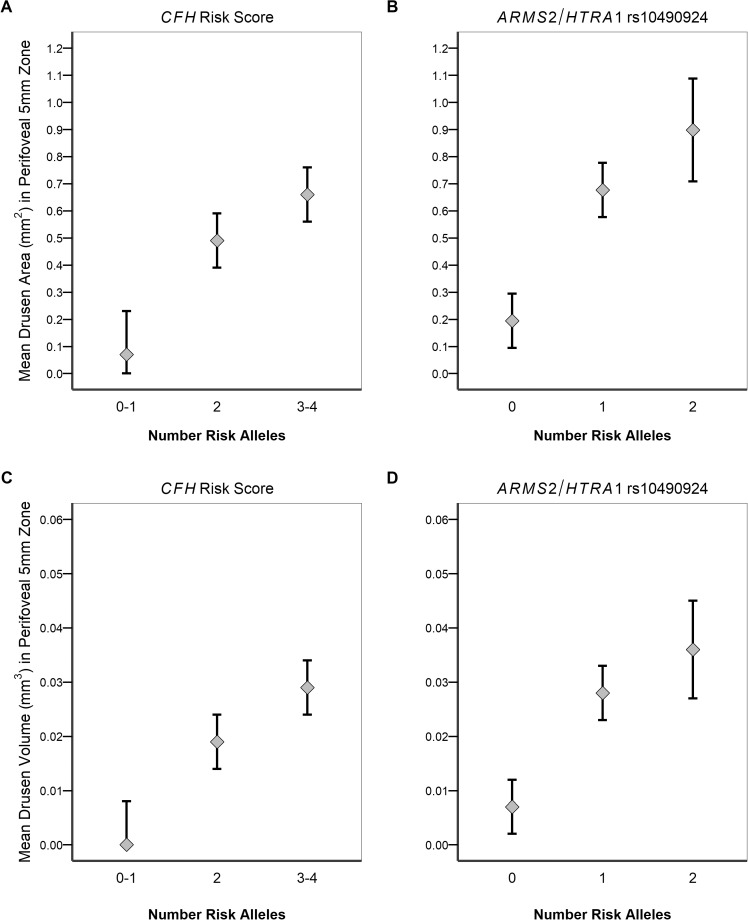
Figure 3.
Independent associations between OCT-derived perifoveal drusen measurements and number of risk alleles for drusen area for (A) CFH score and (B) ARMS2/HTRA1 rs10490924 (P trend = 0.004 and <0.001, respectively) and drusen volume for (C) CFH score and (D) ARMS2/HTRA1 rs10490924 (P trend = 0.002 and <0.001, respectively). The diamond represents the adjusted mean controlling for age, sex, education, smoking, BMI, and AMD grade. The vertical line represents ±SE of the adjusted mean.

