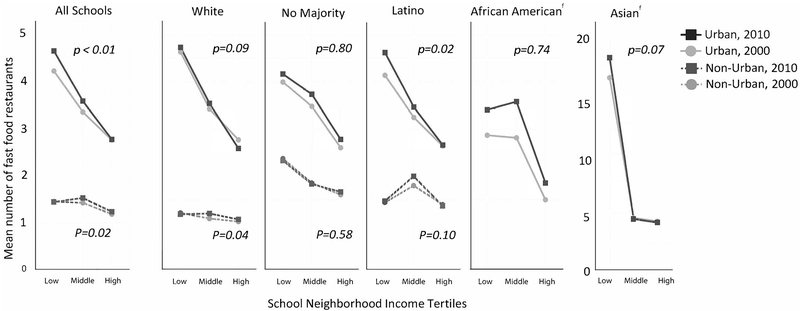
Figure 1. Mean numbera of fast food restaurants near schools,b according to neighborhood income tertiles,c for all schools and stratified by school racial/ethnic composition of the student bodyd and urbanicity.e.
Notes: These p-values are for test of interaction assessing differences in school-neighborhood income gradient in fast food restaurant availability between 2000 and 2010 for schools overall and within each racial/ethnic majority group of schools.
aEstimated from negative binomial regression models that included the main effects of neighborhood income tertiles and year, plus a cross-product term between the two.
bData source: California public school data files, available on the California Department of Education’s website.33,34
cNeighborhood income tertiles are based on median annual household income tertiles (based on U.S. Census 2010 data).36,37
dMajority racial/ethnic composition of the student body refers to >50% of the student body in a racial/ethnic classification (based on data from the California Department of Education, 2010).34
eUrbanicity refers to urban or non-urban (rural, suburban, second city) households in the census tract in which schools were located (based on data from Nielsen PRIZM urbanization measures, 2013).38
fThis group has small sample sizes (n≤25) in some of the income tertiles in non-urban and/or urban areas, thus estimates should be interpreted with caution.

