
Figure 3.
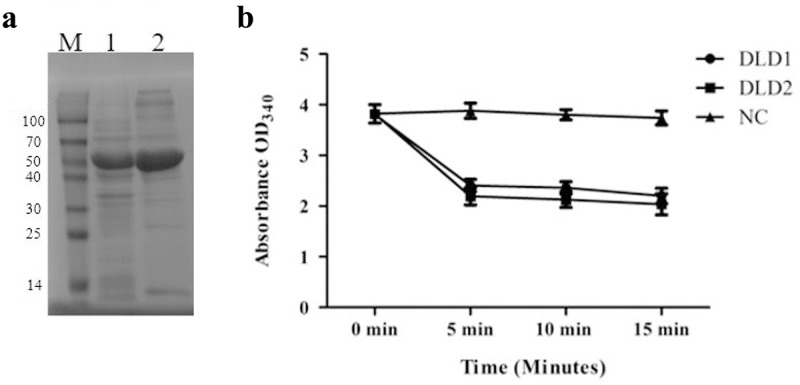
(a): the SDS-PAGE analysis of the recombinant proteins of DLD1 (lane 1) and DLD2 (lane 2), and M is the Marker (kDa). (b): the absorbance at OD340 after the reaction was catalyzed by DLD1 or DLD2. The reaction without DLD1 or DLD2 was used as a control (NC). Data are the means of three independent experiments, and are presented as means ± SD.