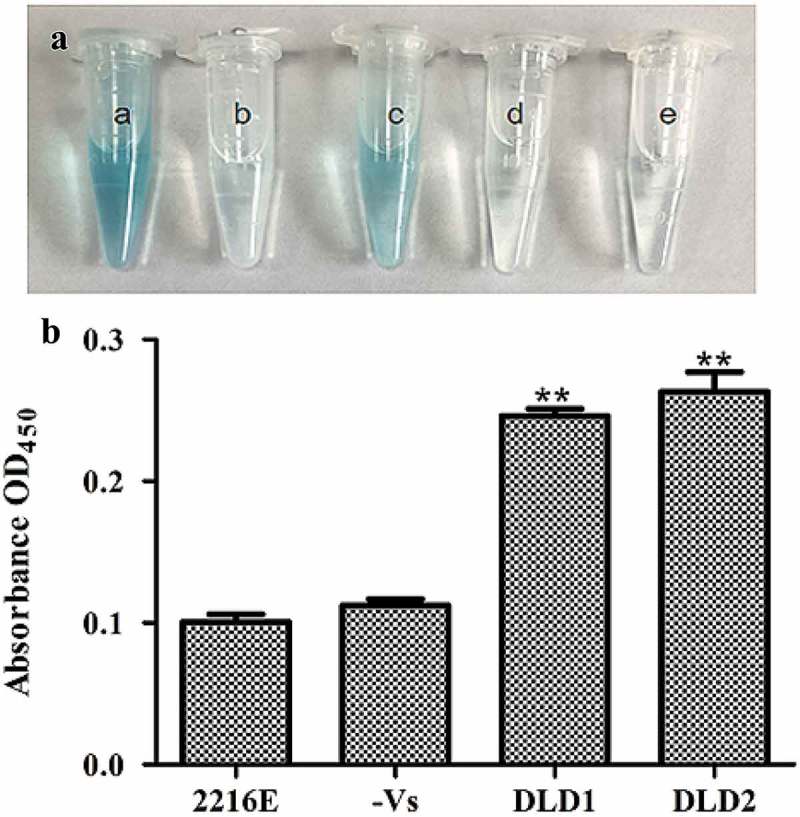
Figure 4.

Determination of DLDs location using whole cell ELISA. The same amount of cells was used as antigen to react with DLD1 or DLD antibody 2. The developed color was measured at 450 nm. (a): a, the cells blocked by DLD1 antibody; b, the negative group; c, the cells blocked by DLD2 antibody; d, the negative group; e, the control group. (b): The absorbance at OD450 of the control group, negative group, V. splendidus reacted with DLD1 antibody and V. splendidus reacted with DLD2 antibody. Data are the means of three independent experiments, and are presented as means ± SD. *P< 0.05, **P< 0.01.
