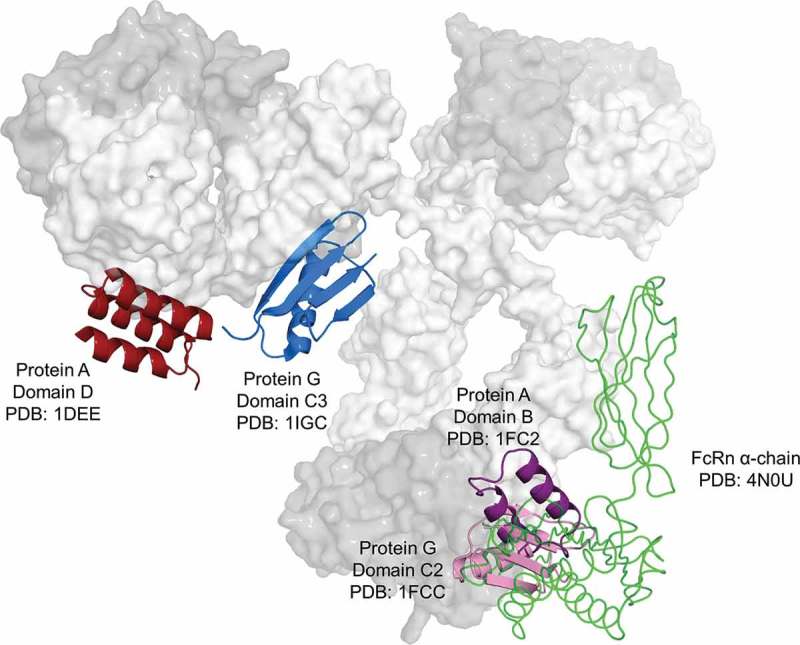
Figure 1.

Compiled 3D representation of PA, PG and FcRn interactions with human IgG1. For illustration purposes, different regions from different isotypes and species were superimposed. PA and PG interacting with the VH3-Fab portion are colored in dark red and blue, respectively. PA, PG, and FcRn (only the extracellular domain of the α-chain is shown) in complex with the Fc region are colored purple, pink, and green, respectively. PDB codes as indicated. Lcs and CH3 domains are shaded in dark gray.
